Fig. 10.
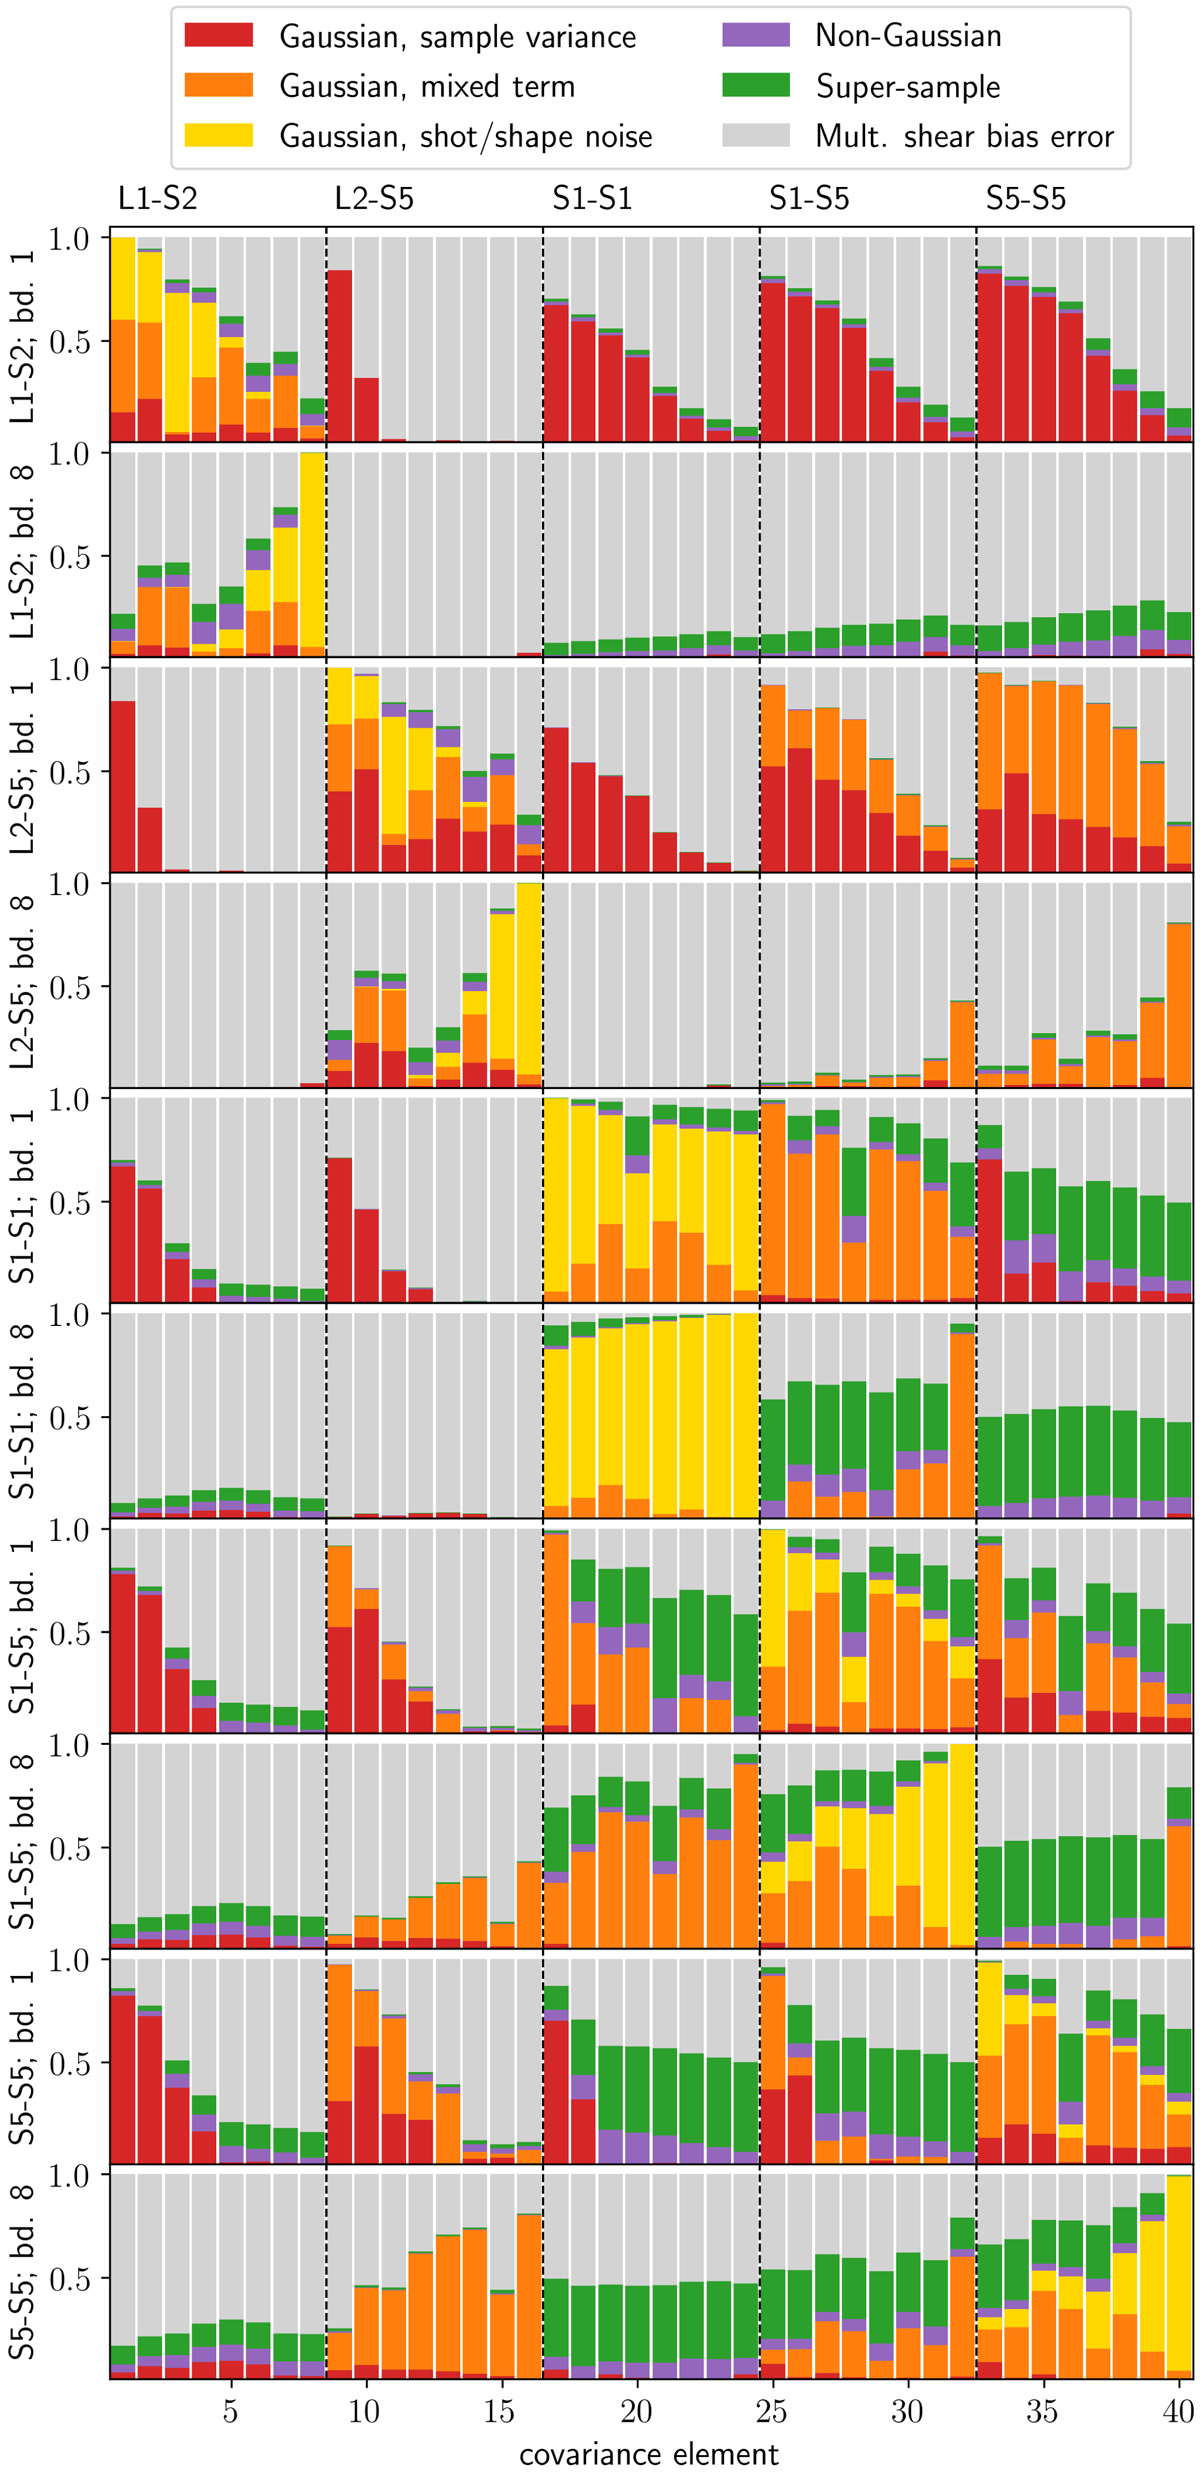
Contributions to selected elements of the analytic band power covariance. Shown are the relative contributions of the absolute values of the six covariance terms: sample variance (red), mixed term (orange), and shot/shape noise (yellow) in the Gaussian covariance; non-Gaussian in-survey covariance (purple) and super-sample covariance (green); and the multiplicative shear bias uncertainty (grey). Each panel corresponds to a single row in the covariance matrix of the full GGL and cosmic variance data vector, for the signal and angular frequency band indicated in the label; columns in each panel have the same ordering of signals but show all 8 bands, respectively. A representative subset of signals was chosen: two GGL signals, as well as a low- and high-redshift cosmic shear signal, and the corresponding redshift bin cross-correlation.
Current usage metrics show cumulative count of Article Views (full-text article views including HTML views, PDF and ePub downloads, according to the available data) and Abstracts Views on Vision4Press platform.
Data correspond to usage on the plateform after 2015. The current usage metrics is available 48-96 hours after online publication and is updated daily on week days.
Initial download of the metrics may take a while.