Fig. 1.
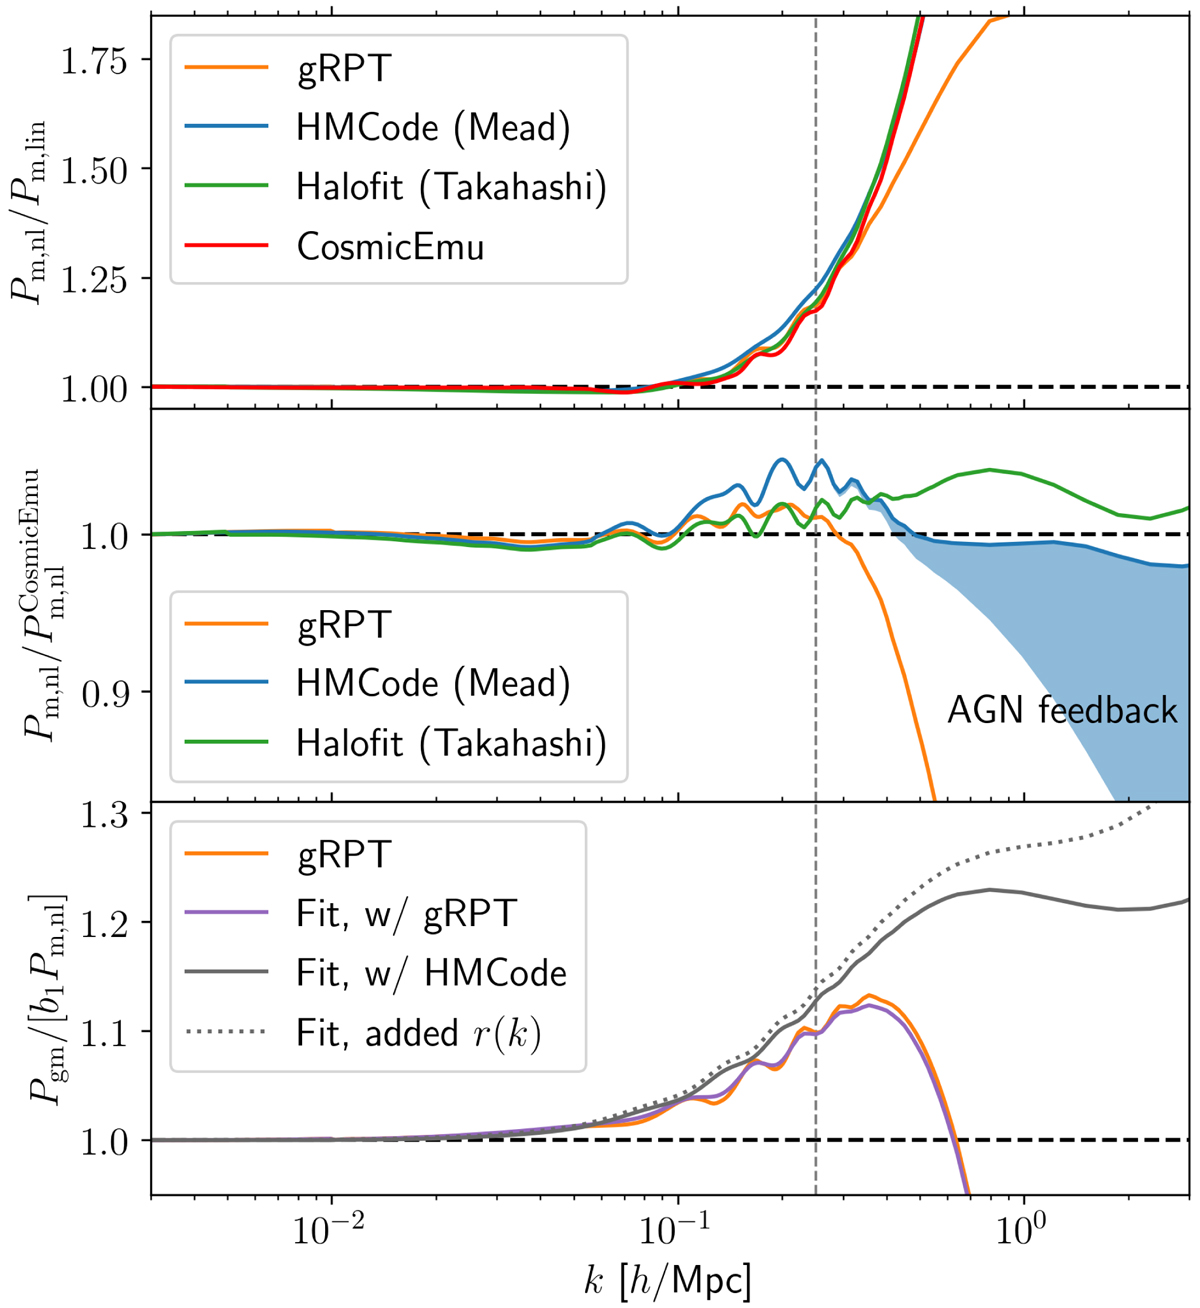
Comparison of 3D power spectra, computed at z = 0.38 and the parameters listed in Table A.1. Top: non-linear matter power spectra relative to the linear matter power spectrum, for the gRPT perturbative model, the Mead et al. (2015) HMCODE, the Takahashi et al. (2012) Halofit prescription, and the CosmicEmu emulated power spectrum (Heitmann et al. 2014). Centre: non-linear matter power spectra relative to the CosmicEmu model. The blue shaded region covers the power spectrum range within the prior range of our AGN feedback description. Bottom: full galaxy-matter power spectrum Pgm relative to the Mead et al. (2015) power spectrum multiplied by the linear galaxy bias, shown for the gRPT perturbation theory model (orange) and the fit formula of Eq. (3), using gRPT (purple) or Mead et al. (2015) (grey) for the non-linear matter power spectrum term. The dotted grey curve includes an additional r(k) term obtained from a semi-analytic model of a galaxy sample similar to the one used in our analysis. The vertical grey line indicates the smallest scales used in the galaxy clustering modelling.
Current usage metrics show cumulative count of Article Views (full-text article views including HTML views, PDF and ePub downloads, according to the available data) and Abstracts Views on Vision4Press platform.
Data correspond to usage on the plateform after 2015. The current usage metrics is available 48-96 hours after online publication and is updated daily on week days.
Initial download of the metrics may take a while.