Fig. 5
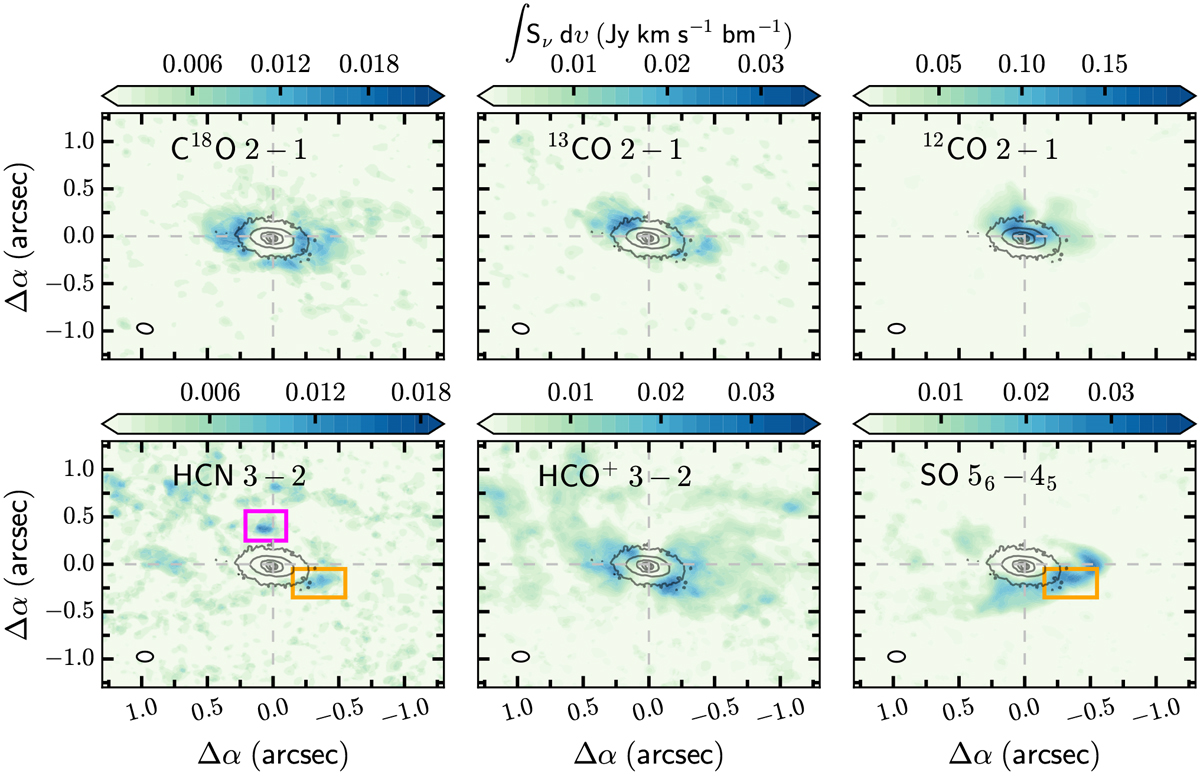
Zeroth moment maps of the six most strongly detected molecular lines. They are calculated by integrating the emission from 1 to 12 km s−1, considering only pixels where the emission >3σ (1σ values are listed in Table 2). The synthesized beams are indicated in the lower left. The dust continuum emission of the aggregated observations is plotted linearly as black contours from 5σ to maximum intensity. There are two highlighted regions in the integrated HCN map, and one in the SO map: the supposed outflow component is shown in pink and the supposed disk component is in orange. See the text for details.
Current usage metrics show cumulative count of Article Views (full-text article views including HTML views, PDF and ePub downloads, according to the available data) and Abstracts Views on Vision4Press platform.
Data correspond to usage on the plateform after 2015. The current usage metrics is available 48-96 hours after online publication and is updated daily on week days.
Initial download of the metrics may take a while.