Fig. 4
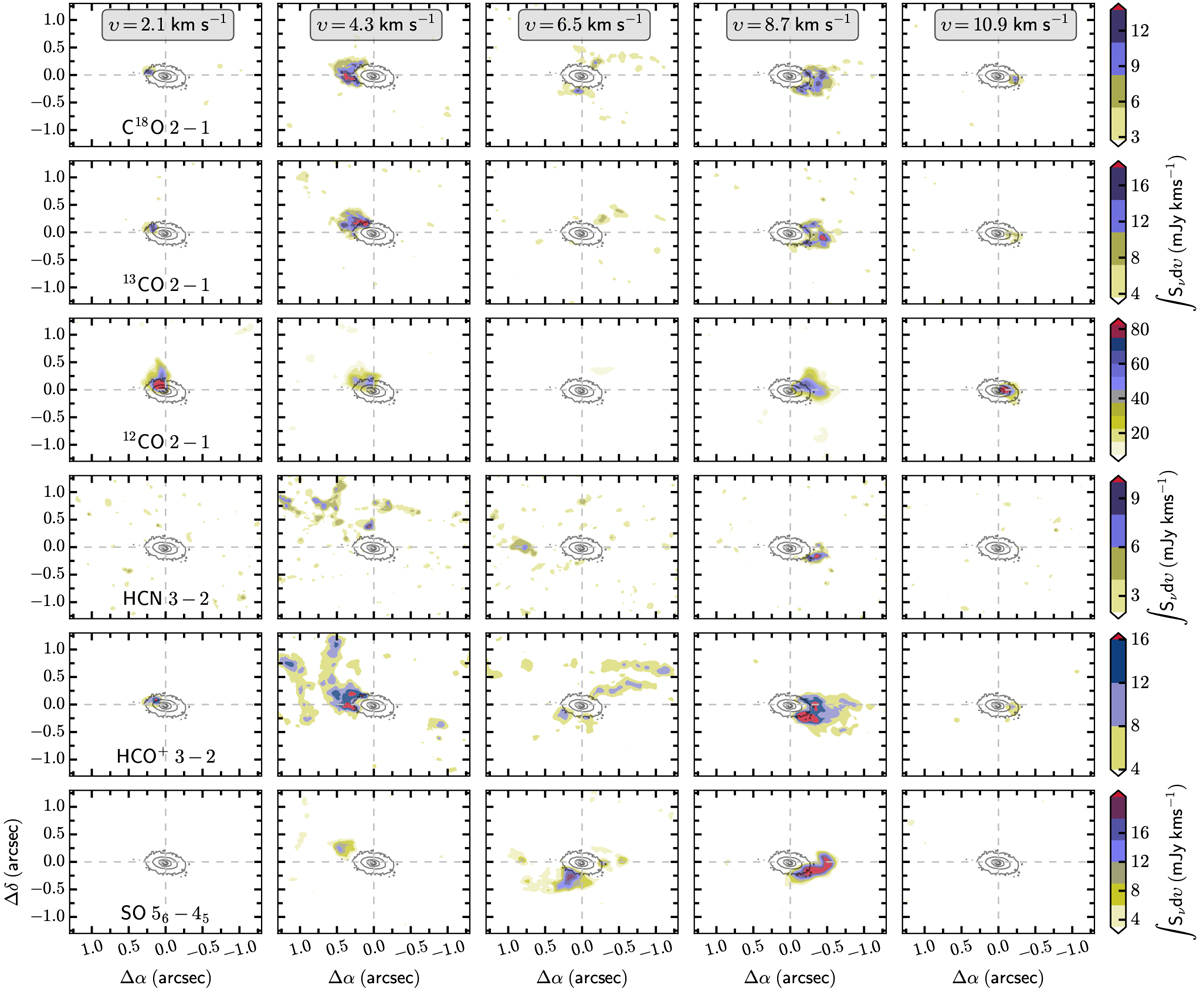
Channel maps of the six brightest molecular lines are shown: C18O 2−1, 13CO 2−1, 12CO 2−1, HCN 3−2, HCO+ 3− 2, and SO 56−45 (top to bottom). Each panel shows the line intensities integrated over six channels (left to right) and after clipping pixels with intensities <3σ. The grey box in the first row indicates the average velocity of the six channels. The color scale for molecular line is shown at the right hand side. The dust continuum emission of the aggregated observations is plotted linearly as black contours from 5σ to maximum intensity. Beam sizes for each line can be found in Table 2.
Current usage metrics show cumulative count of Article Views (full-text article views including HTML views, PDF and ePub downloads, according to the available data) and Abstracts Views on Vision4Press platform.
Data correspond to usage on the plateform after 2015. The current usage metrics is available 48-96 hours after online publication and is updated daily on week days.
Initial download of the metrics may take a while.