Fig. 2
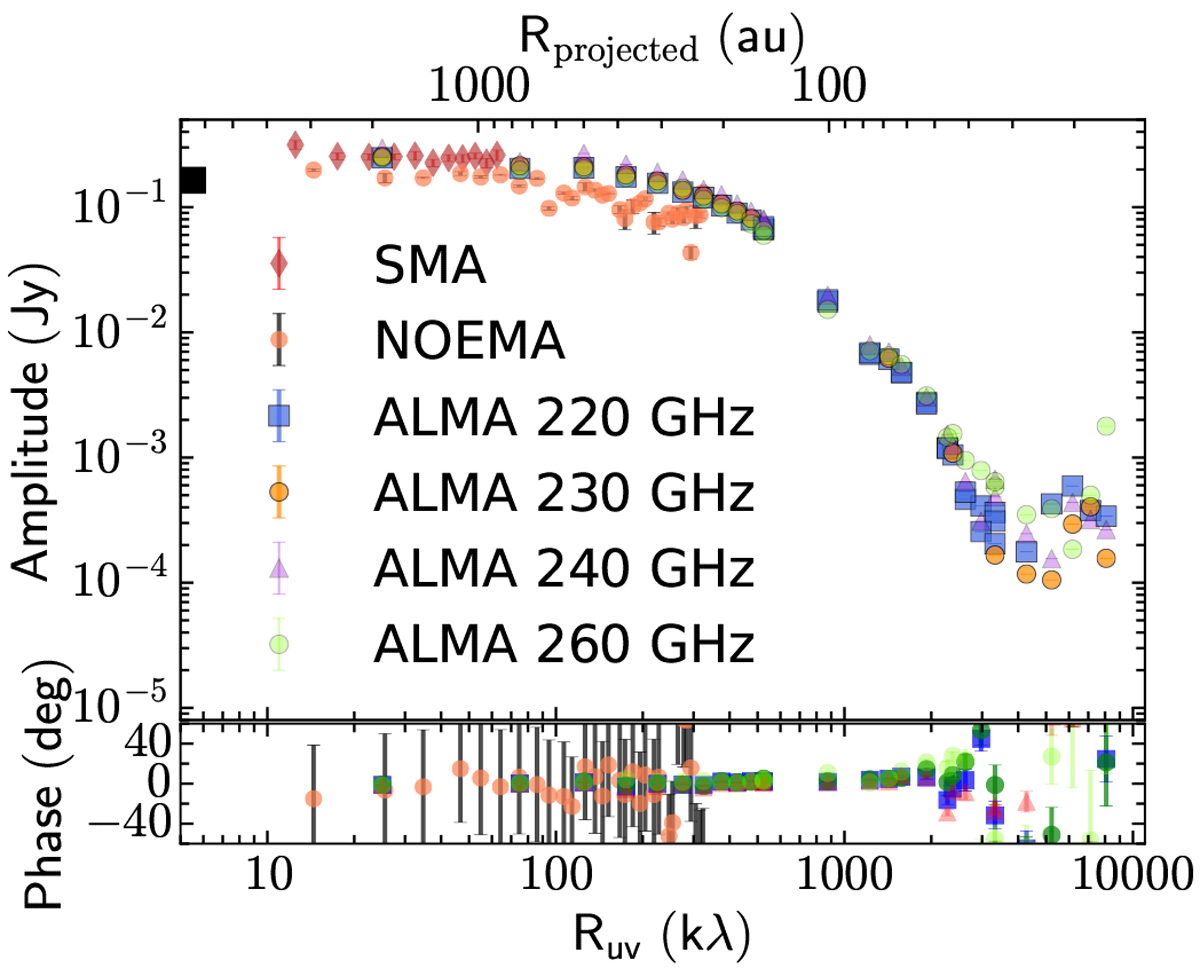
Dust continuum amplitudes and phases as a function of projected baselines Ruv in kλ. Different colors and symbols show the various data sets used. The black, square box near the axis shows the 850 μm single-dish flux density scaled to 1.1 mm (see Harsono et al. 2014). The long baseline ALMA data are split into four different frequencies: 220, 230, 240 and 260 GHz (see Table 2). The standard deviation of each radial bin is also shown, while the corresponding physical scale in au is indicated on the top axis.
Current usage metrics show cumulative count of Article Views (full-text article views including HTML views, PDF and ePub downloads, according to the available data) and Abstracts Views on Vision4Press platform.
Data correspond to usage on the plateform after 2015. The current usage metrics is available 48-96 hours after online publication and is updated daily on week days.
Initial download of the metrics may take a while.