Fig. 1
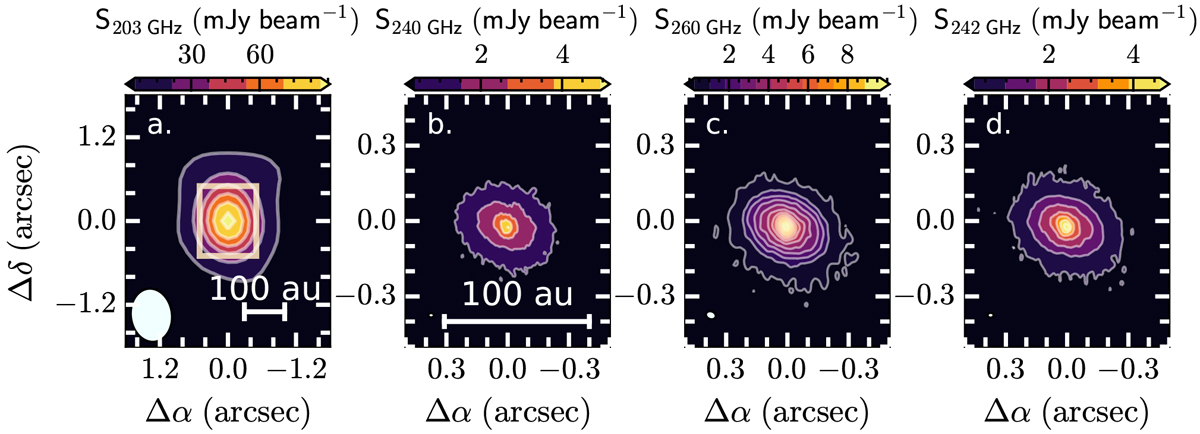
Dust continuum images at various frequencies. The color scale is shown on the top of each panel starting at 5σ. The white contours indicate the 5, 20, 35,... σ contours up to the peak intensity. A scale of 100 au is shown in the first two panels for reference. The synthesized beam is indicated by a white ellipse in the bottom left corner of each panel. a: NOEMA observations at 203 GHz. The color scale spans linearly from 0 to the maximum intensity of 93 mJy beam−1. The square box indicates the 1″ × 1″ region of the ALMA data that is shown in panels b, c and d. b: dust continuum image of the 240 GHz ALMA data. The color scale spans up to the maximum intensity of 5 mJy beam−1. c: dust continuum image of the 260 GHz ALMA data. The color scale spans from 0 to the maximum intensity of 9.8 mJy beam−1. d: dust continuum emission of the combined ALMA data imaged at 242 GHz. Similarly, the color scale spans from 0 to the maximum intensity of 5.1 mJy beam−1.
Current usage metrics show cumulative count of Article Views (full-text article views including HTML views, PDF and ePub downloads, according to the available data) and Abstracts Views on Vision4Press platform.
Data correspond to usage on the plateform after 2015. The current usage metrics is available 48-96 hours after online publication and is updated daily on week days.
Initial download of the metrics may take a while.