Open Access
Fig. 3
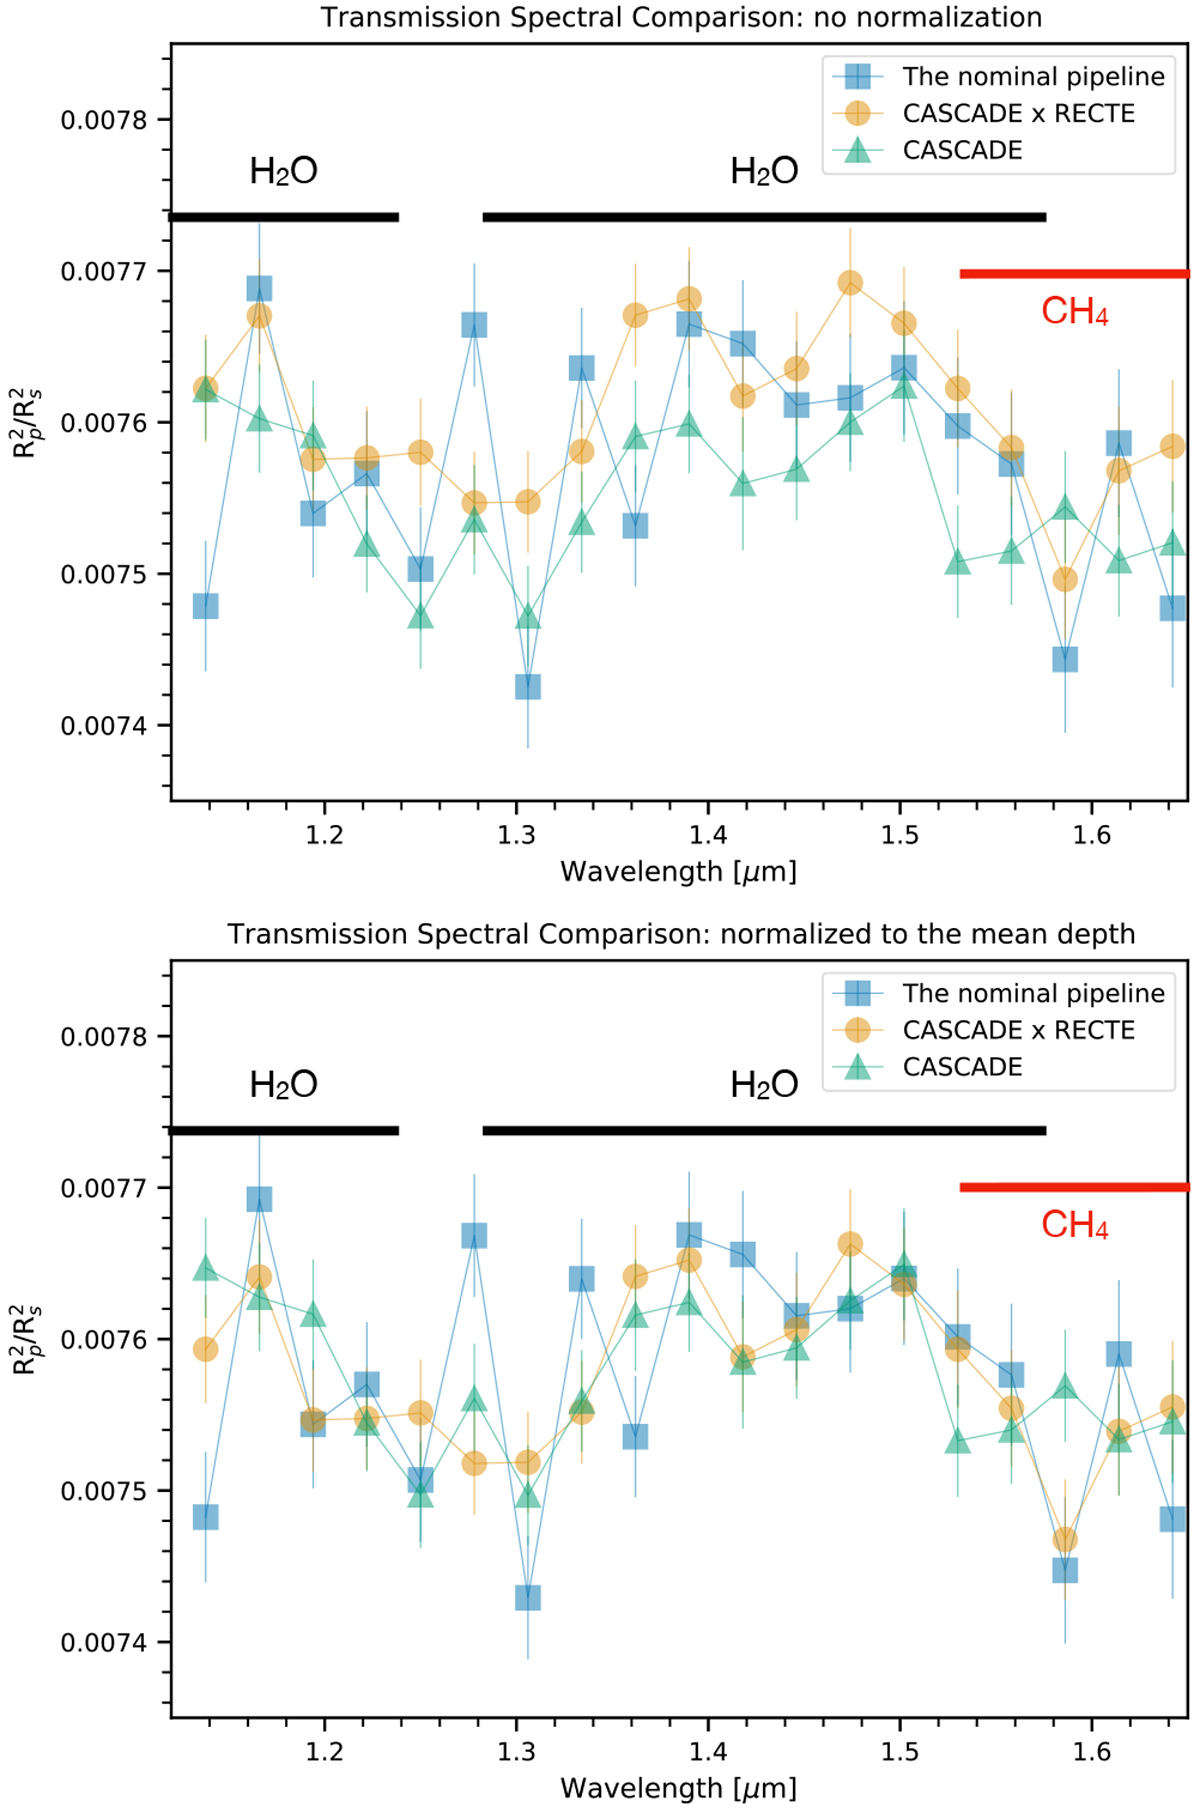
Comparison of transmission spectra obtained with different pipelines. Upper panel: original spectra. Lower panel: spectra scaled to the same average depth. After scaling, the spectra using the same raw data extraction as CASCADE, but different systematic treatment (CASCADE and CASCADExRECTE), are consistent with each other.
Current usage metrics show cumulative count of Article Views (full-text article views including HTML views, PDF and ePub downloads, according to the available data) and Abstracts Views on Vision4Press platform.
Data correspond to usage on the plateform after 2015. The current usage metrics is available 48-96 hours after online publication and is updated daily on week days.
Initial download of the metrics may take a while.