Fig. 14
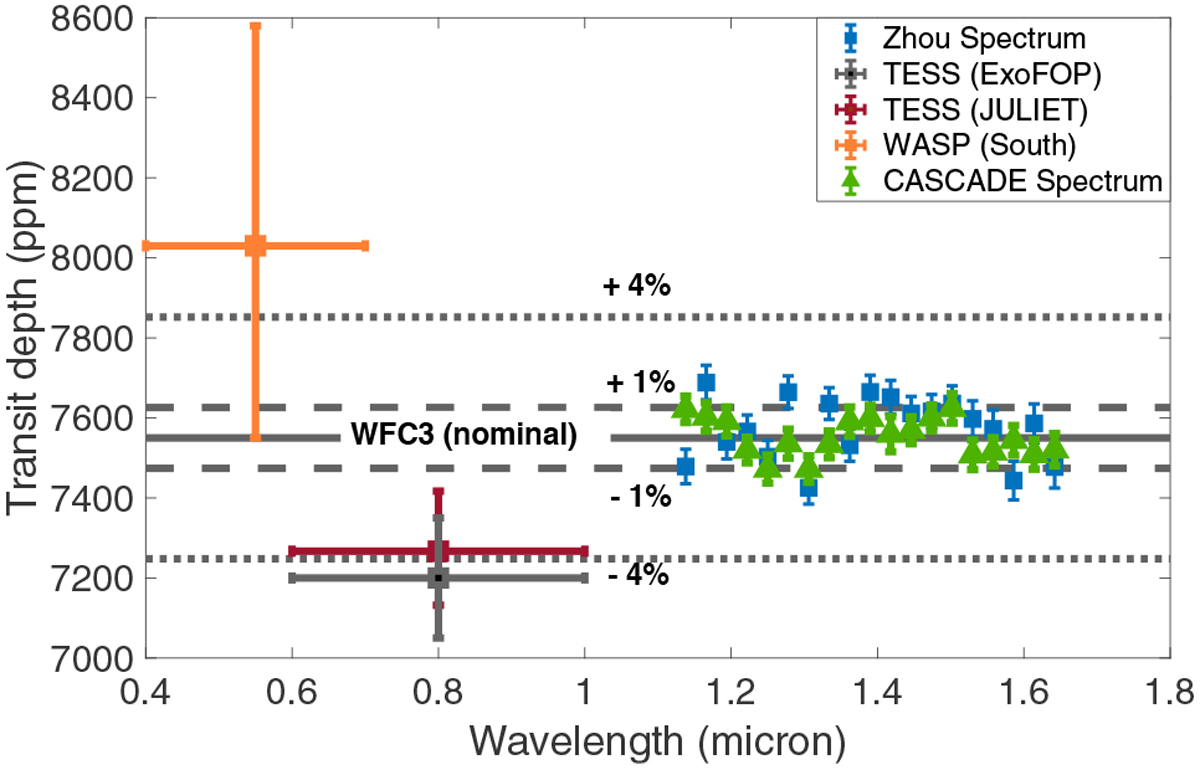
HST transmission spectra from the nominal and CASCADE pipeline compared with TESS transit depth, reduced by ExoFOP,our independent reanalysis with JULIET, and the WASP South transit depth. The solid gray line denotes the nominal transit depth in the WFC3 wavelength range. The dashed and dotted lines show radius inflation or deflation by 1 and 4%, respectively.
Current usage metrics show cumulative count of Article Views (full-text article views including HTML views, PDF and ePub downloads, according to the available data) and Abstracts Views on Vision4Press platform.
Data correspond to usage on the plateform after 2015. The current usage metrics is available 48-96 hours after online publication and is updated daily on week days.
Initial download of the metrics may take a while.