Fig. 9.
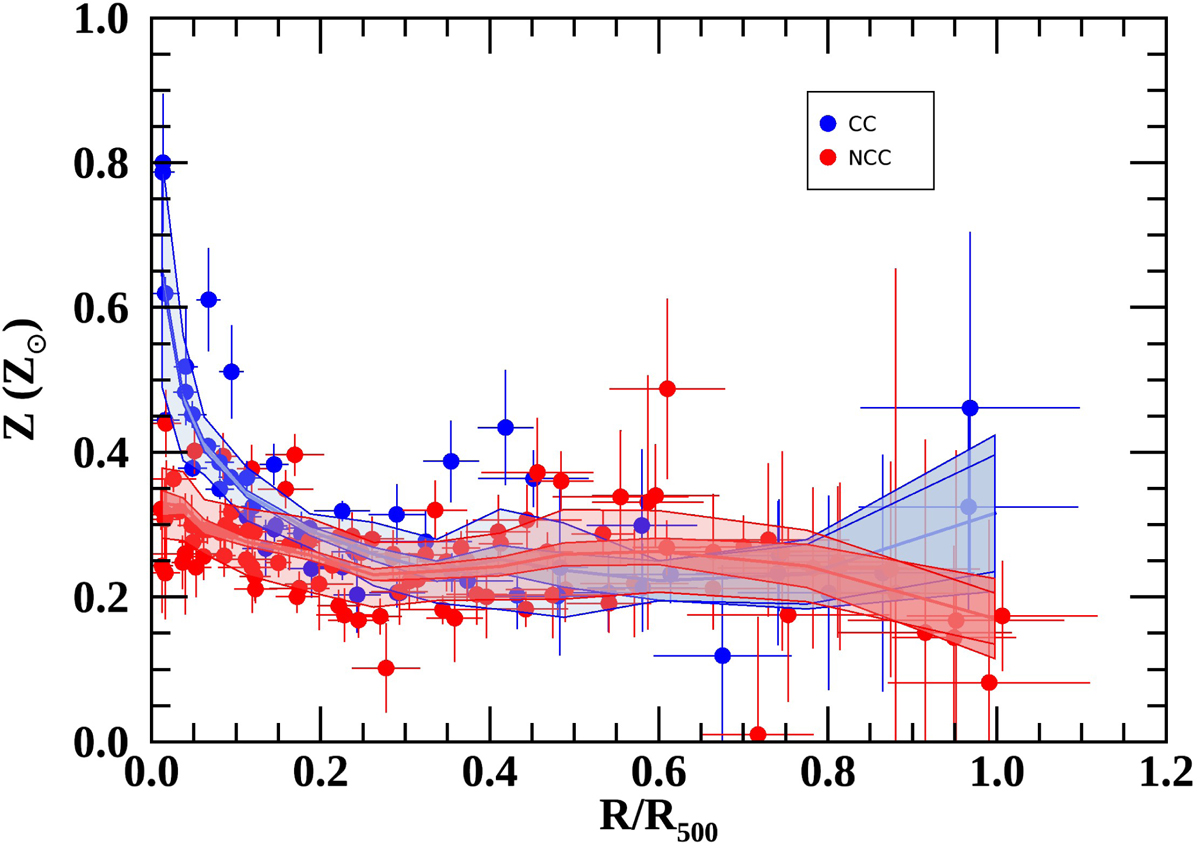
Abundance profiles as a function of R/R500 for cool-core (blue) and non-cool-core (red) subsamples. Average profiles for both subsamples are overlaid. The dark and light shaded areas indicate respectively the statistical error and the total scatter.
Current usage metrics show cumulative count of Article Views (full-text article views including HTML views, PDF and ePub downloads, according to the available data) and Abstracts Views on Vision4Press platform.
Data correspond to usage on the plateform after 2015. The current usage metrics is available 48-96 hours after online publication and is updated daily on week days.
Initial download of the metrics may take a while.