Fig. 3.
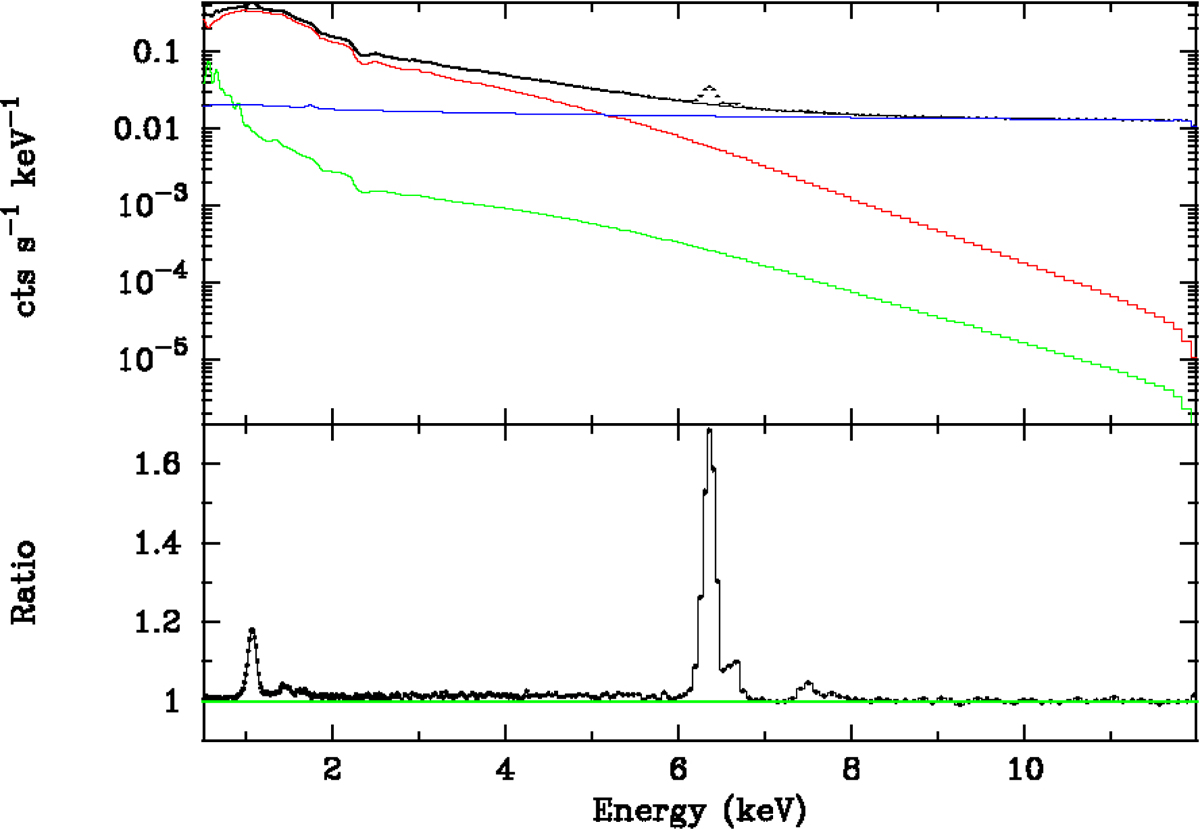
Simulated ICM spectrum from an intermediate radius. Top panel: breakdown of the total spectrum (black) in source (red), sky foreground, and background (green), and instrumental background (blue) components. Bottom panel: to highlight the role of line emission, we show the ratio of simulated data to model with the abundance parameter in the source model set to 0 (see Sect. 2.3.1 for details).
Current usage metrics show cumulative count of Article Views (full-text article views including HTML views, PDF and ePub downloads, according to the available data) and Abstracts Views on Vision4Press platform.
Data correspond to usage on the plateform after 2015. The current usage metrics is available 48-96 hours after online publication and is updated daily on week days.
Initial download of the metrics may take a while.