Fig. C.2.
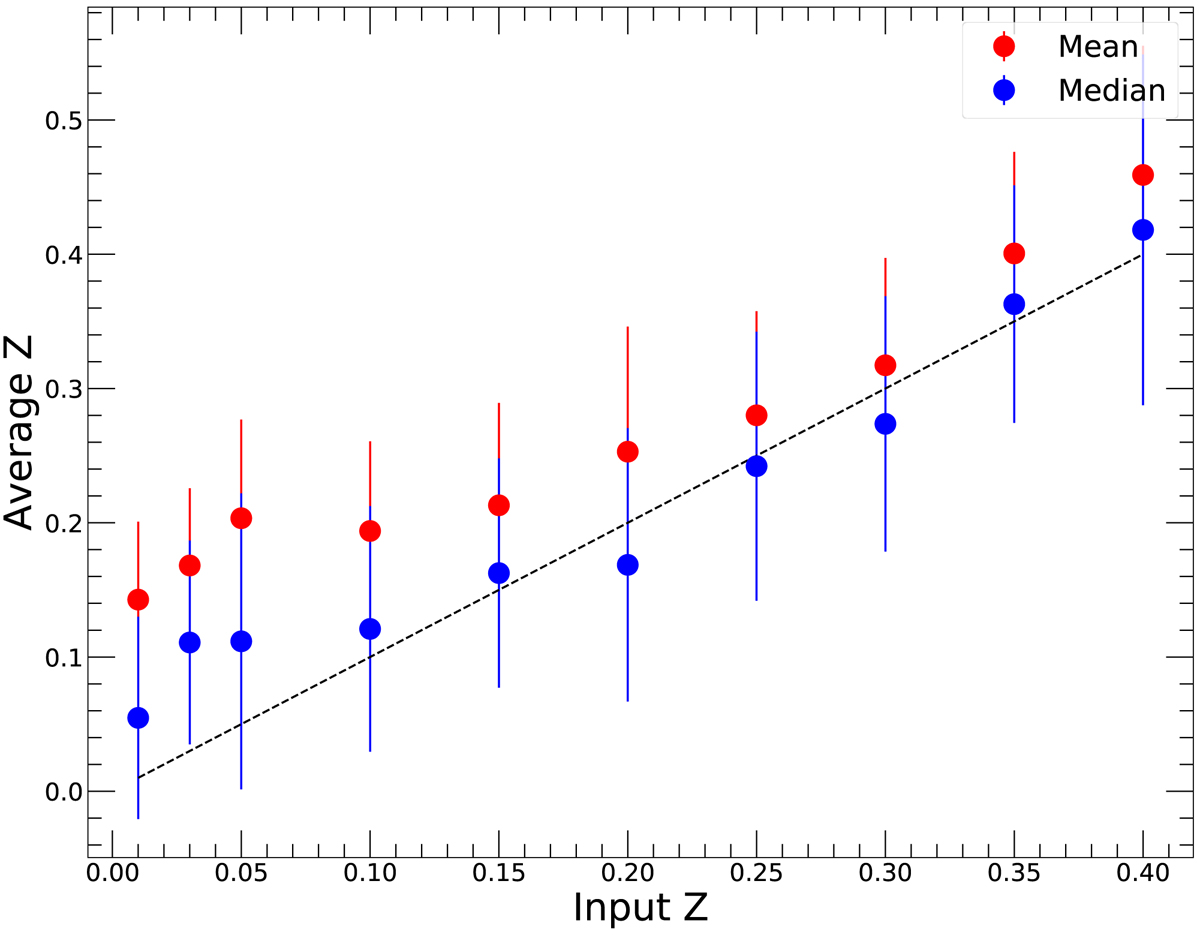
Most probable average sample values (filled circles) and standard deviation of the expected sample averages (error bars) as a function of input metallicity for sets of 100 simulated spectra. The data points show the expected weighted mean (red) and median (blue). The black dashed line is the one-to-one relation.
Current usage metrics show cumulative count of Article Views (full-text article views including HTML views, PDF and ePub downloads, according to the available data) and Abstracts Views on Vision4Press platform.
Data correspond to usage on the plateform after 2015. The current usage metrics is available 48-96 hours after online publication and is updated daily on week days.
Initial download of the metrics may take a while.