Fig. 15.
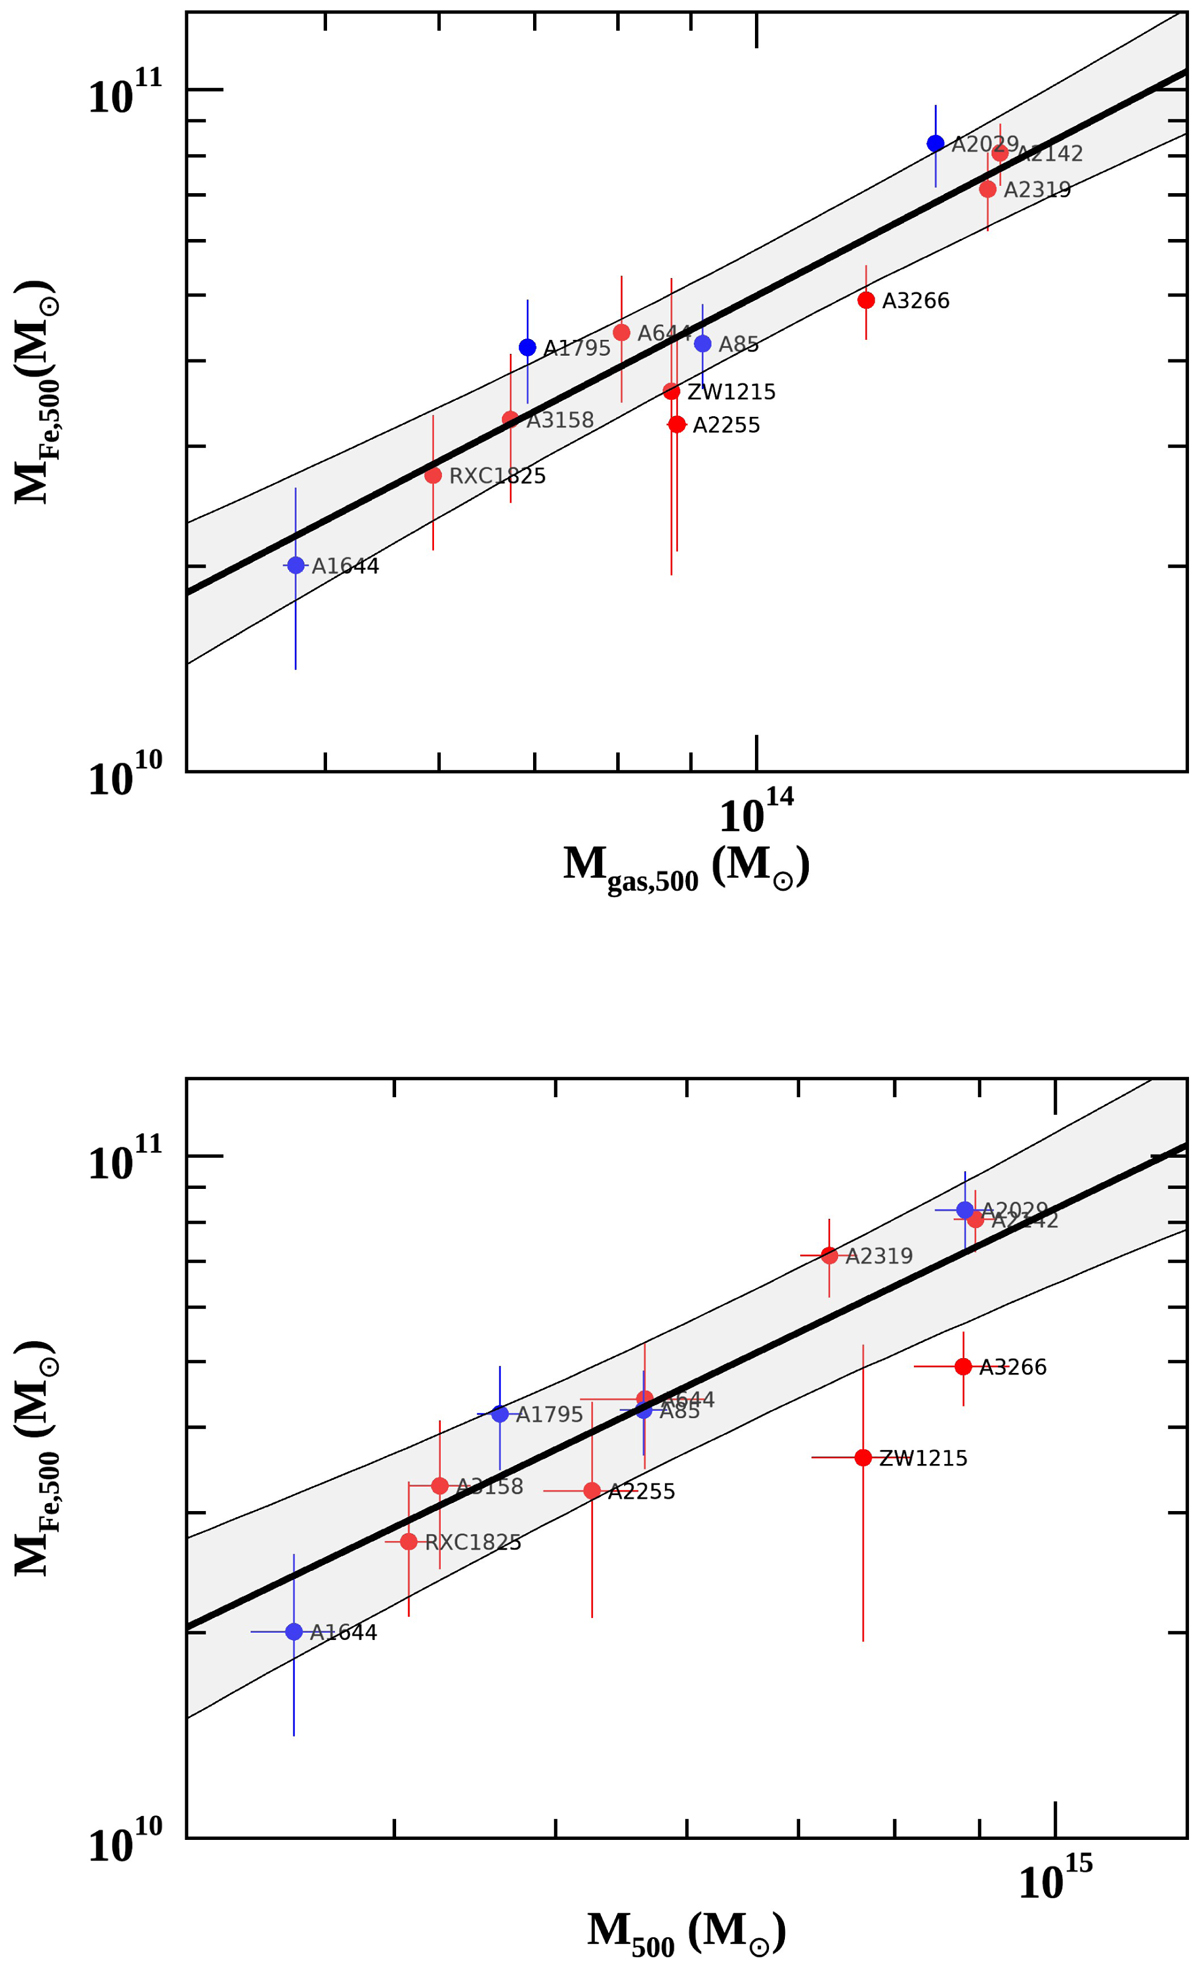
Top panel: MFe within R500 vs. Mgas within R500; bottom panel: MFe within R500 vs. Mtot within R500. Blue and red mark cool-core and non-cool-core systems, respectively. Black lines are the best fits and shaded areas indicate the 1σ confidence regions, including intrinsic scatters.
Current usage metrics show cumulative count of Article Views (full-text article views including HTML views, PDF and ePub downloads, according to the available data) and Abstracts Views on Vision4Press platform.
Data correspond to usage on the plateform after 2015. The current usage metrics is available 48-96 hours after online publication and is updated daily on week days.
Initial download of the metrics may take a while.