Fig. 8
Expected ![]() and
and ![]() for 58 candidate HMSCs located in the 3–5 kpc distance range. Red and blue contours show the distributions of
for 58 candidate HMSCs located in the 3–5 kpc distance range. Red and blue contours show the distributions of ![]() and
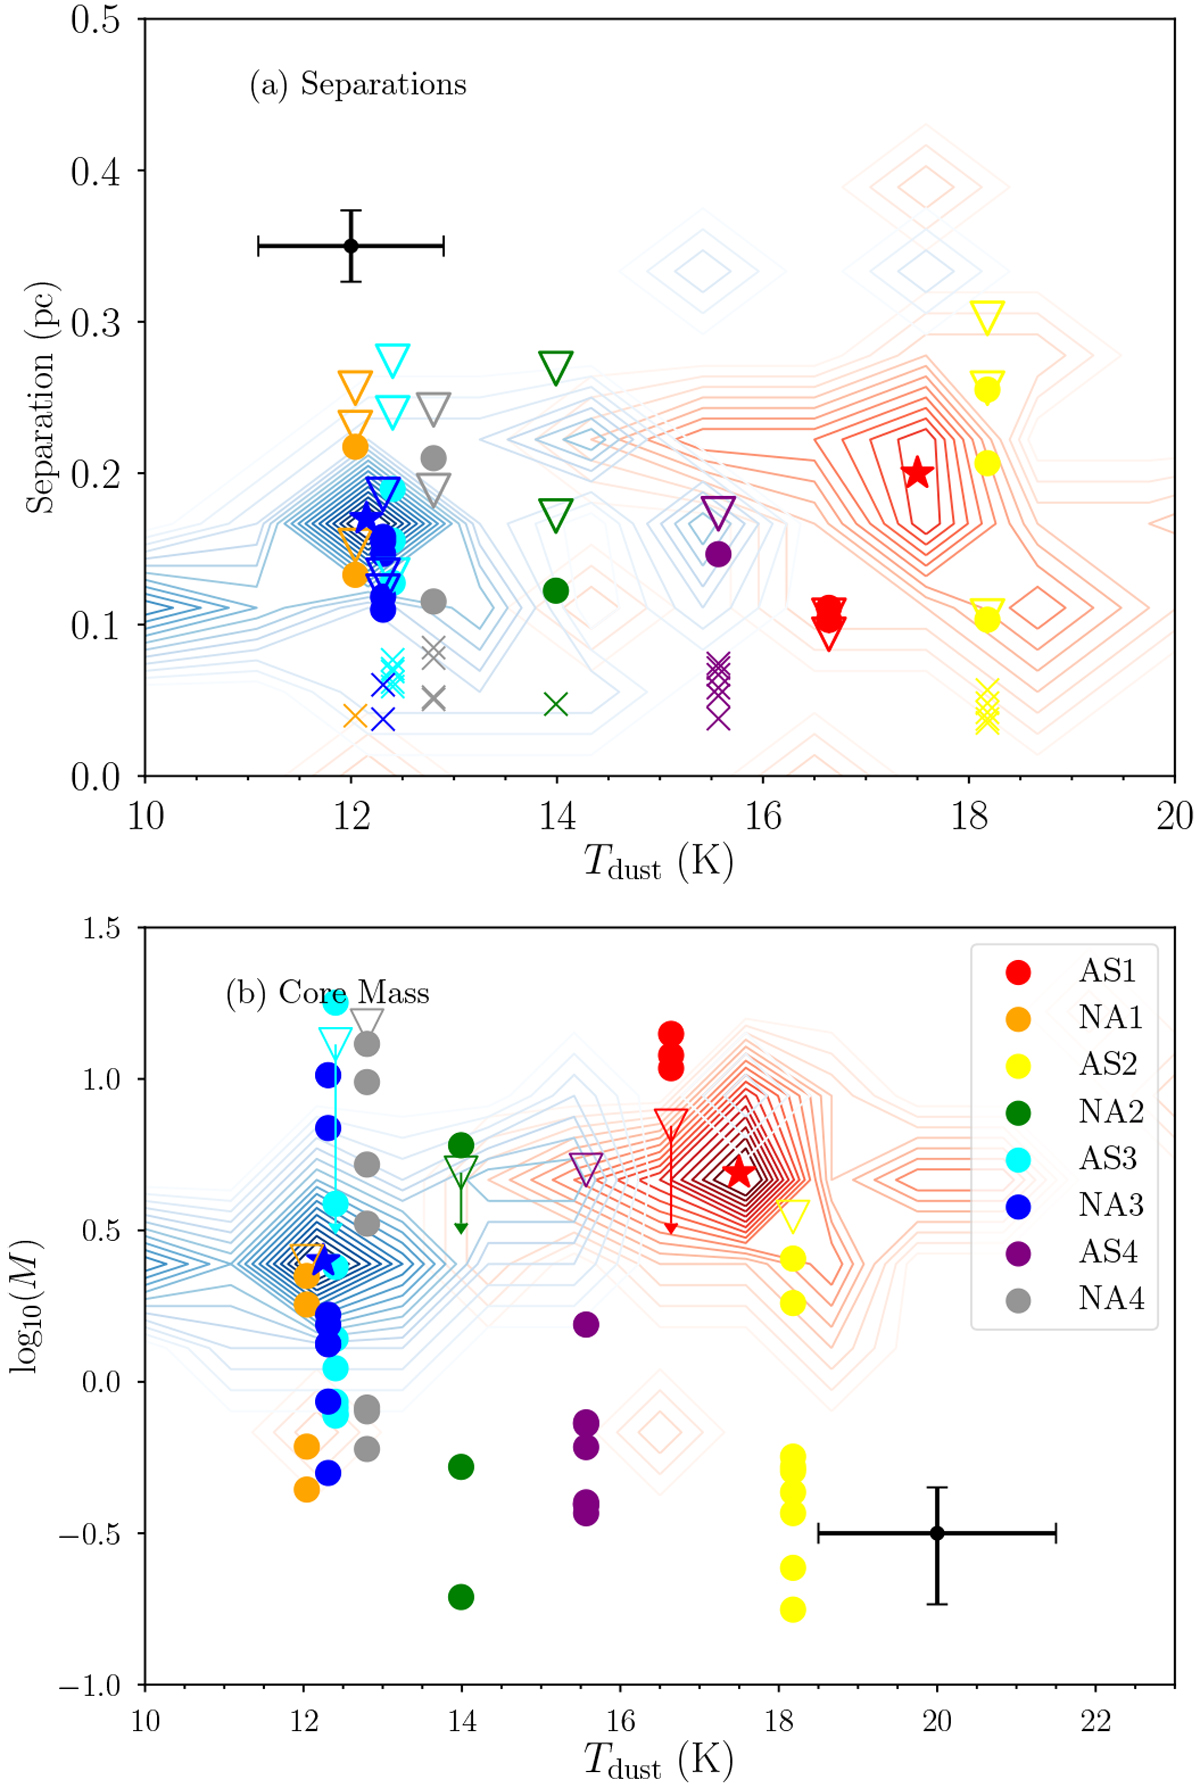
and ![]() for all strongly impacted AS (31 S-type AS, see details in Paper I) and all NA (27), respectively. Contours with a heavier color mean a larger number of points. Red and blue stars mark the peaks of corresponding distributions. Panel a: distributions of
for all strongly impacted AS (31 S-type AS, see details in Paper I) and all NA (27), respectively. Contours with a heavier color mean a larger number of points. Red and blue stars mark the peaks of corresponding distributions. Panel a: distributions of ![]() . The triangles, crosses, and circles represent ensemble MST separations, core short MST separations, and core long MST separations for the ALMA sources in this paper, respectively. Panel b: distributions of
. The triangles, crosses, and circles represent ensemble MST separations, core short MST separations, and core long MST separations for the ALMA sources in this paper, respectively. Panel b: distributions of ![]() . Circles and triangles represent core mass and average ensemble mass for the ALMA sources in this paper, respectively.
. Circles and triangles represent core mass and average ensemble mass for the ALMA sources in this paper, respectively.
Current usage metrics show cumulative count of Article Views (full-text article views including HTML views, PDF and ePub downloads, according to the available data) and Abstracts Views on Vision4Press platform.
Data correspond to usage on the plateform after 2015. The current usage metrics is available 48-96 hours after online publication and is updated daily on week days.
Initial download of the metrics may take a while.