Fig. 7
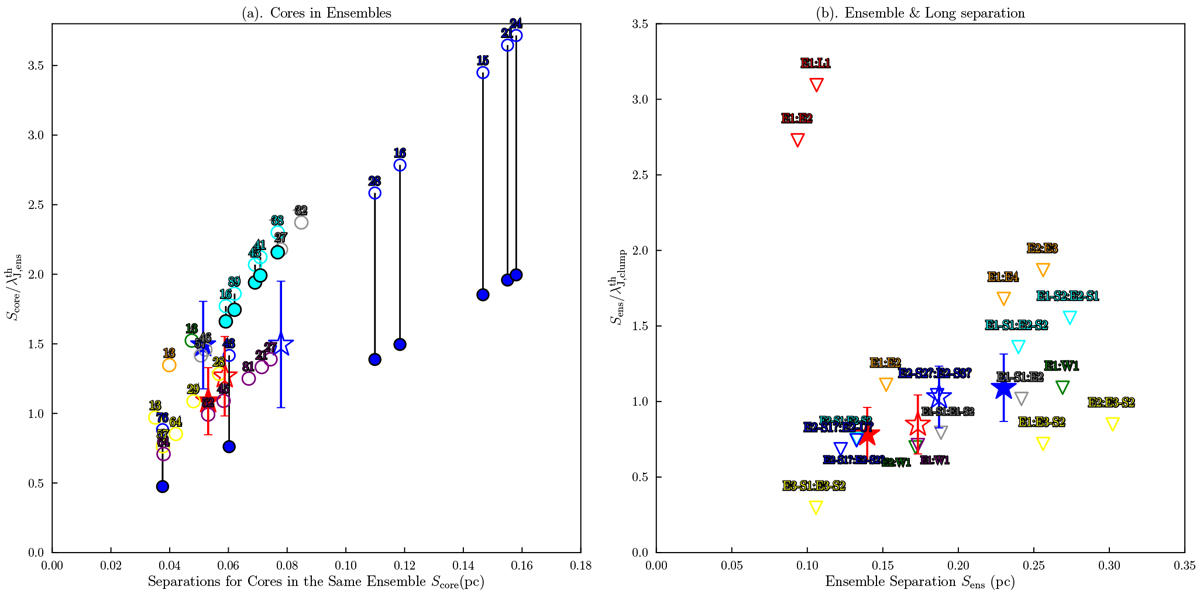
Thermal dominant fragmentation. Red and blue filled stars represent the median values for AS and NA, except for AS3 and NA3, while the stars with blank facecolor represent the median values for all AS and NA. The labels near the data points mark the ALMA cores (in the same ensembles) or ensembles making up the separations.Panel a: separations for the cores in the same ensembles, scaled by ensemble thermal Jeans length ![]() . The color-coding for different clumps is similar to that of Fig. 5. The circles with cyan and blue facecolors are the recalculations in the case of cylindrical fragmentation for AS3 and NA3, respectively. Panel b: ensemble MST separations scaled by clump thermal Jeans length
. The color-coding for different clumps is similar to that of Fig. 5. The circles with cyan and blue facecolors are the recalculations in the case of cylindrical fragmentation for AS3 and NA3, respectively. Panel b: ensemble MST separations scaled by clump thermal Jeans length ![]() .
.
Current usage metrics show cumulative count of Article Views (full-text article views including HTML views, PDF and ePub downloads, according to the available data) and Abstracts Views on Vision4Press platform.
Data correspond to usage on the plateform after 2015. The current usage metrics is available 48-96 hours after online publication and is updated daily on week days.
Initial download of the metrics may take a while.