Fig. 6
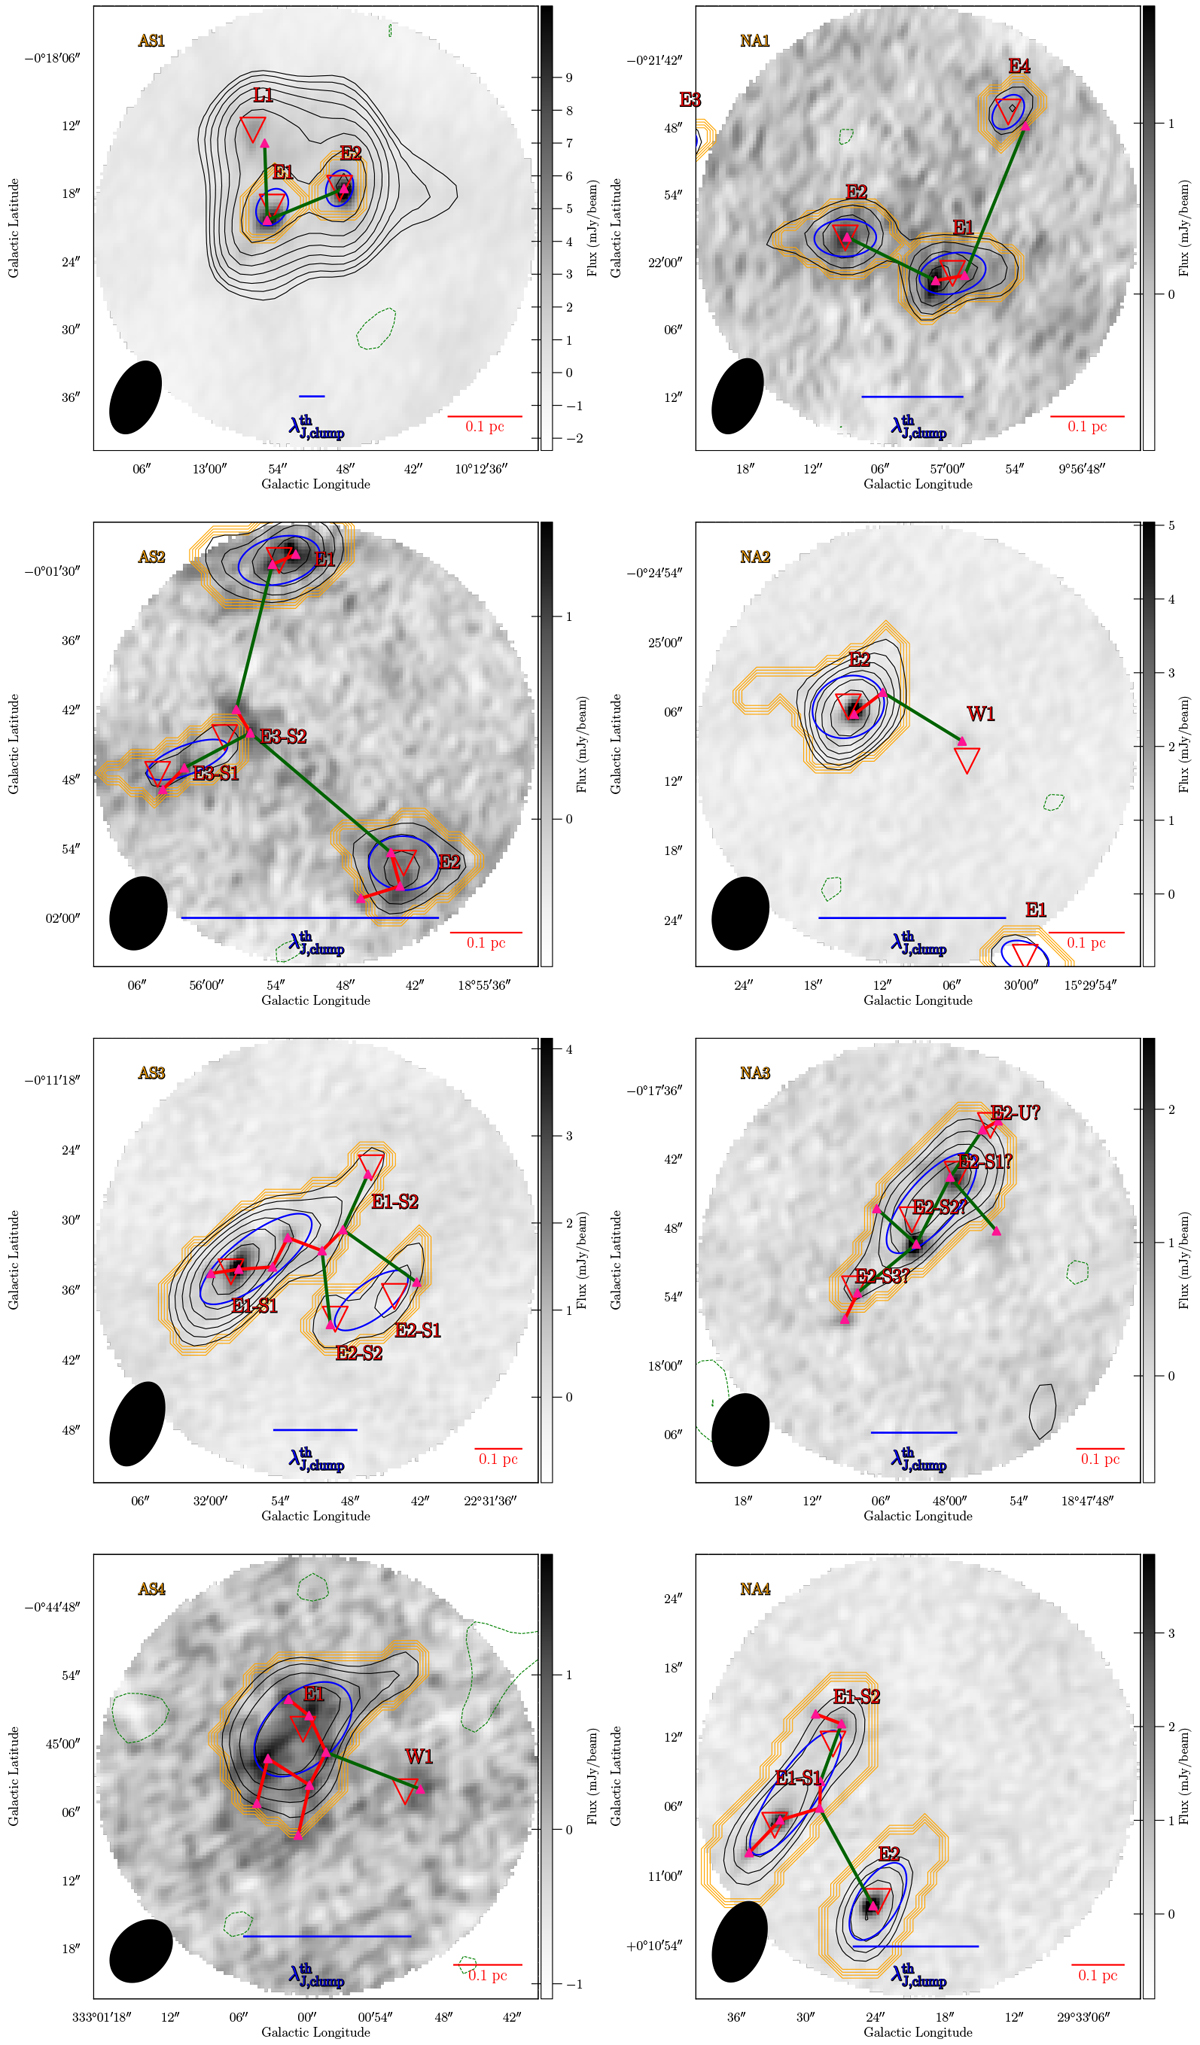
Hierarchical fragmentation. Grayscale shows the primary beam uncorrected 7 m + 12 m combined images, overlaid with primary beam uncorrected 7 m ACA continuum in black (positive) and green (negative) contours with levels of ± 7 m image rms × [3, 31.25, 31.50, 31.75, 32.0, 32.25, 32.50, 32.75, 33.0]. Blue ellipses and yellow contours show the “leaves” and their shapes derived by Astrodendro. Large and small triangles mark the positions of candidate ensembles and cores, respectively. Green and red lines are MST core separations the same as those in Figs. 3 and 4. Blue lines indicate the clump thermal Jeans length, ![]() .
.
Current usage metrics show cumulative count of Article Views (full-text article views including HTML views, PDF and ePub downloads, according to the available data) and Abstracts Views on Vision4Press platform.
Data correspond to usage on the plateform after 2015. The current usage metrics is available 48-96 hours after online publication and is updated daily on week days.
Initial download of the metrics may take a while.