Fig. 5
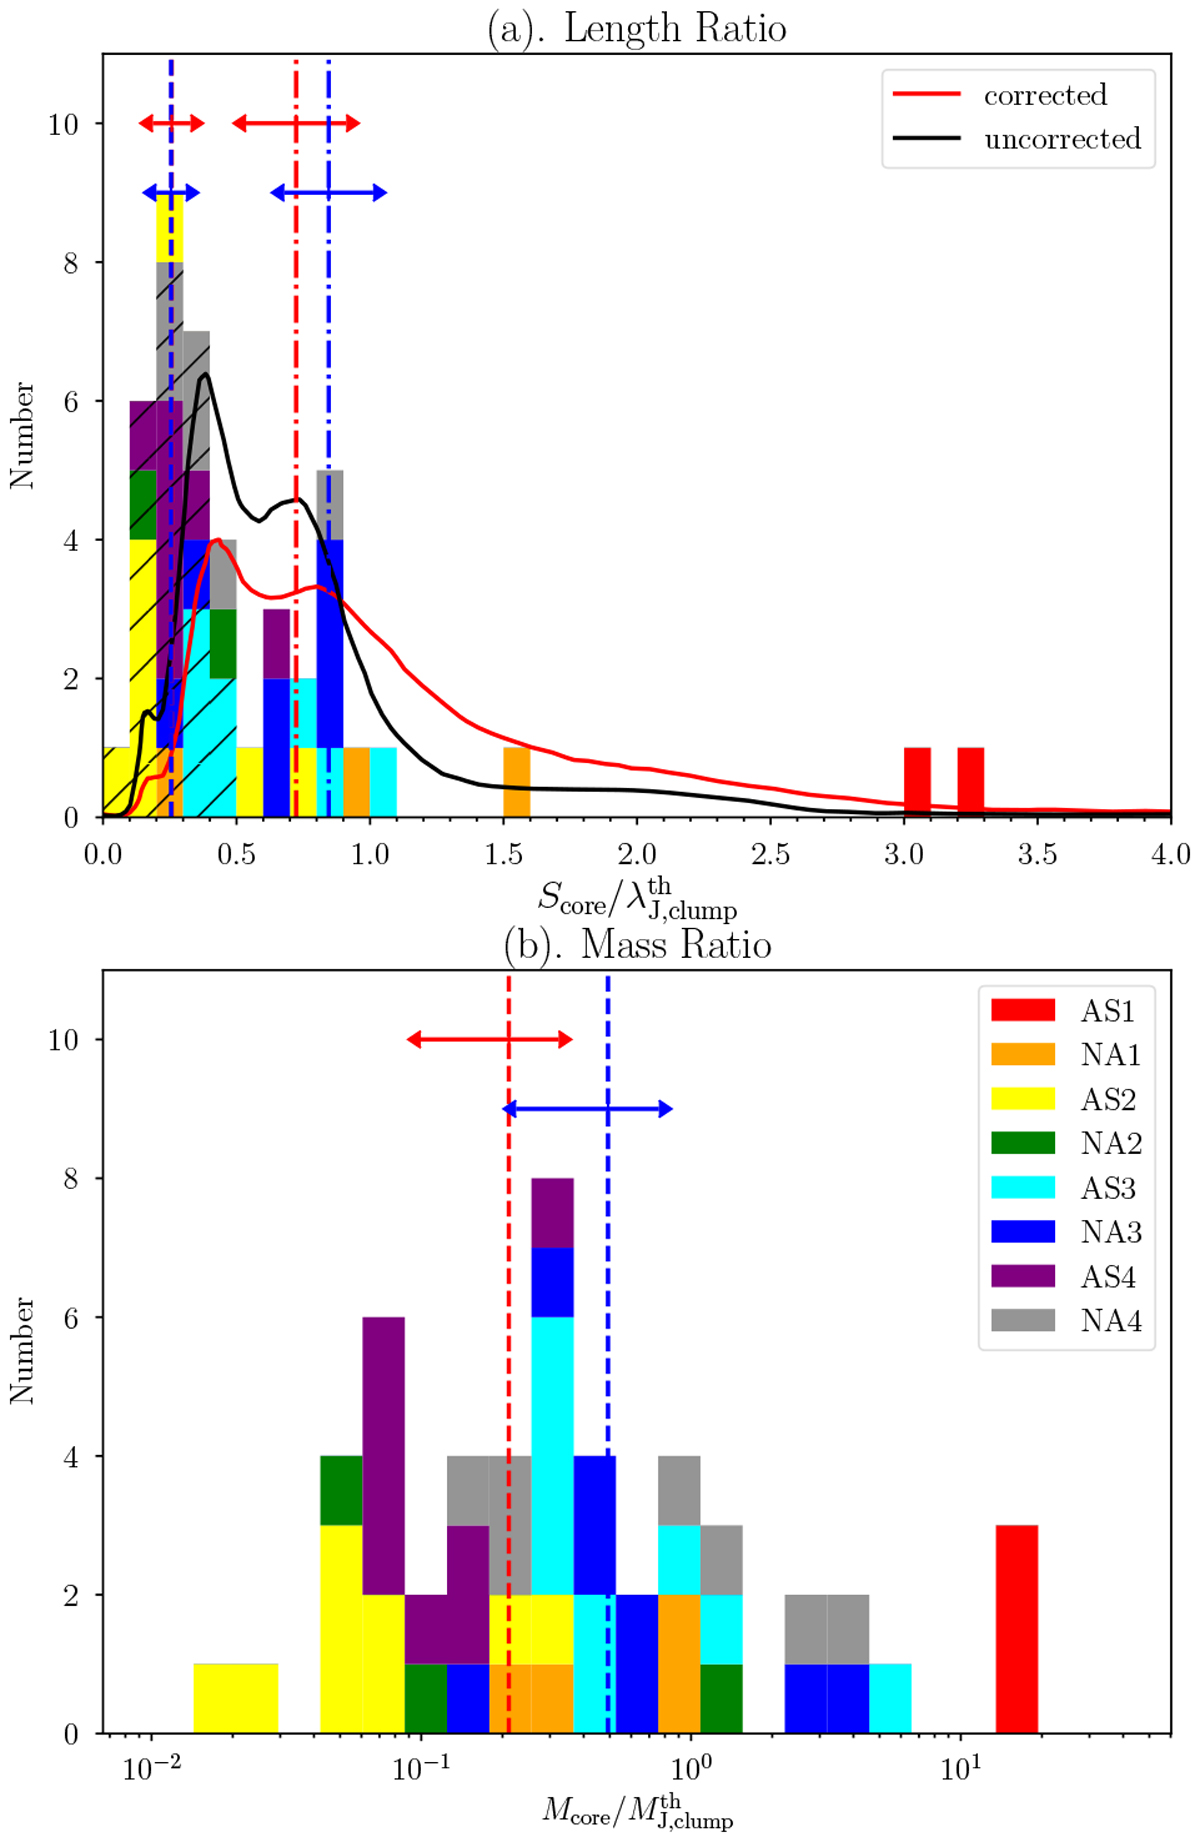
Core separations and mass scaled by clump thermal Jeans parameters. Histograms with different colors represent different candidate HMSCs. Panel a: scaled core separations ![]() . The hatched histograms indicate short separations that two cores are in the same ensembles (see Sect. 4.3). Black and red solid lines represent the distributions derived from Svoboda et al. (2019) by multiplying their probability density functions (PDFs) with the total number of cores in our cases. Black and red lines show the projected nearest neighbor separations and the projection-corrected nearest neighbor separations, respectively, see details in Svoboda et al. (2019). Blue and red dash lines are median values of short separations for NA and AS, respectively. Similarly, dash-dotted lines indicate median values of long separations. Panel b: scaled mass
. The hatched histograms indicate short separations that two cores are in the same ensembles (see Sect. 4.3). Black and red solid lines represent the distributions derived from Svoboda et al. (2019) by multiplying their probability density functions (PDFs) with the total number of cores in our cases. Black and red lines show the projected nearest neighbor separations and the projection-corrected nearest neighbor separations, respectively, see details in Svoboda et al. (2019). Blue and red dash lines are median values of short separations for NA and AS, respectively. Similarly, dash-dotted lines indicate median values of long separations. Panel b: scaled mass ![]() . The red andblue lines indicate median values for AS and NA, respectively.
. The red andblue lines indicate median values for AS and NA, respectively.
Current usage metrics show cumulative count of Article Views (full-text article views including HTML views, PDF and ePub downloads, according to the available data) and Abstracts Views on Vision4Press platform.
Data correspond to usage on the plateform after 2015. The current usage metrics is available 48-96 hours after online publication and is updated daily on week days.
Initial download of the metrics may take a while.