Fig. 3
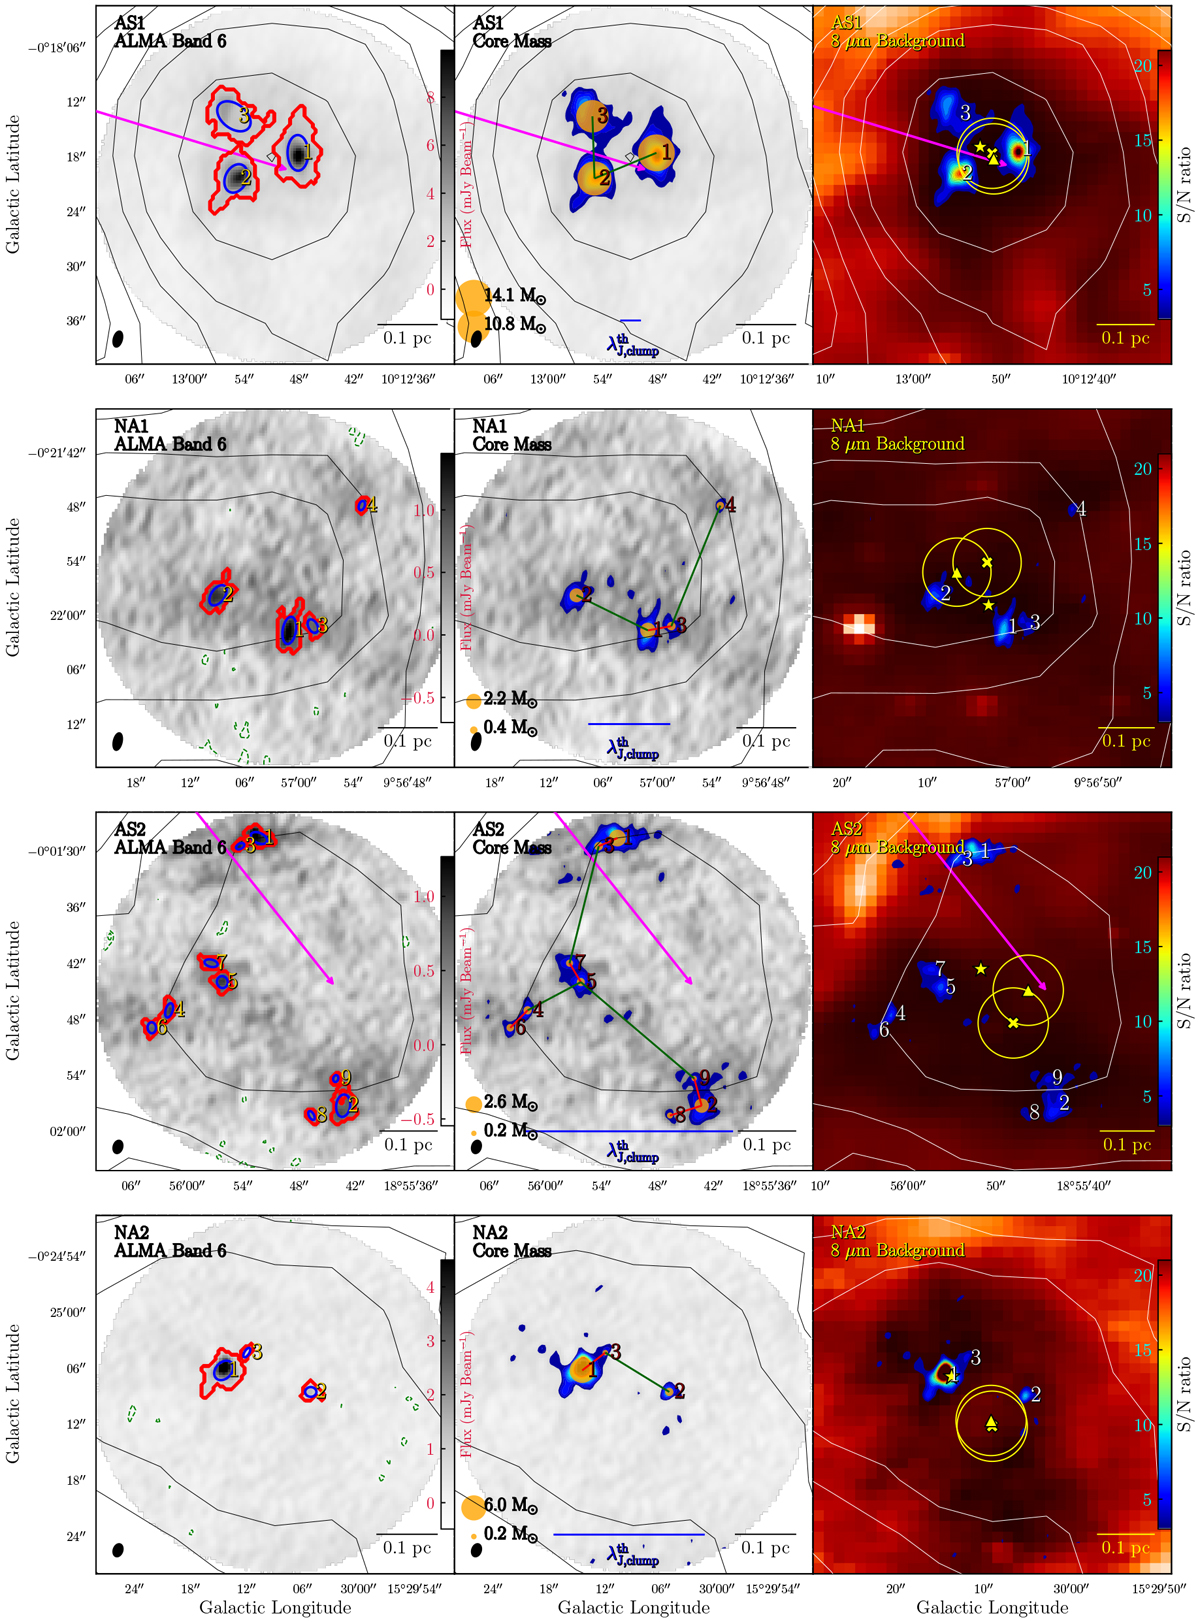
7 m + 12 m combined 1.3 mm continuum. The presented images are uncorrected for the primary beam for displaying a homogeneous noise background. Four rows of panels: AS1, NA1, AS2, and NA2, respectively. ALMA emission (grayscale) is overlaid with the color-filled contours starting from 3 rms to 21 rms with a step of 1 rms. Each row has three panels. Left panel: extracted cores (blue ellipses) and their Astrodendrogram “leaves” (red contours). Green dashed contours show the negative emission starting from − 3 rms with a step of − 1 rms. ATLASGAL emission contours (black) are the same as Fig. 1. The synthesized beam (black ellipse) is shown in the bottom left. Central panel: core mass is shown by the orange circle whose area is in proportion to mass. The numbers close to cores are core indexes ranking from the highest to the lowest mass. The highest and the lowest masses are indicated in the bottom left. MST short and long separations are shown in red and green lines, respectively, see more in Fig. 5. Blue lines indicate ![]() . Magenta arrows show the impacted direction. Right panel: ALMA 1.3 mm color contours overlaid on GLIMPSE 8 μm background. See Sect. 5.1 for the meanings of yellow stars, crosses, triangles, and associated circles.
. Magenta arrows show the impacted direction. Right panel: ALMA 1.3 mm color contours overlaid on GLIMPSE 8 μm background. See Sect. 5.1 for the meanings of yellow stars, crosses, triangles, and associated circles.
Current usage metrics show cumulative count of Article Views (full-text article views including HTML views, PDF and ePub downloads, according to the available data) and Abstracts Views on Vision4Press platform.
Data correspond to usage on the plateform after 2015. The current usage metrics is available 48-96 hours after online publication and is updated daily on week days.
Initial download of the metrics may take a while.