Fig. A.3
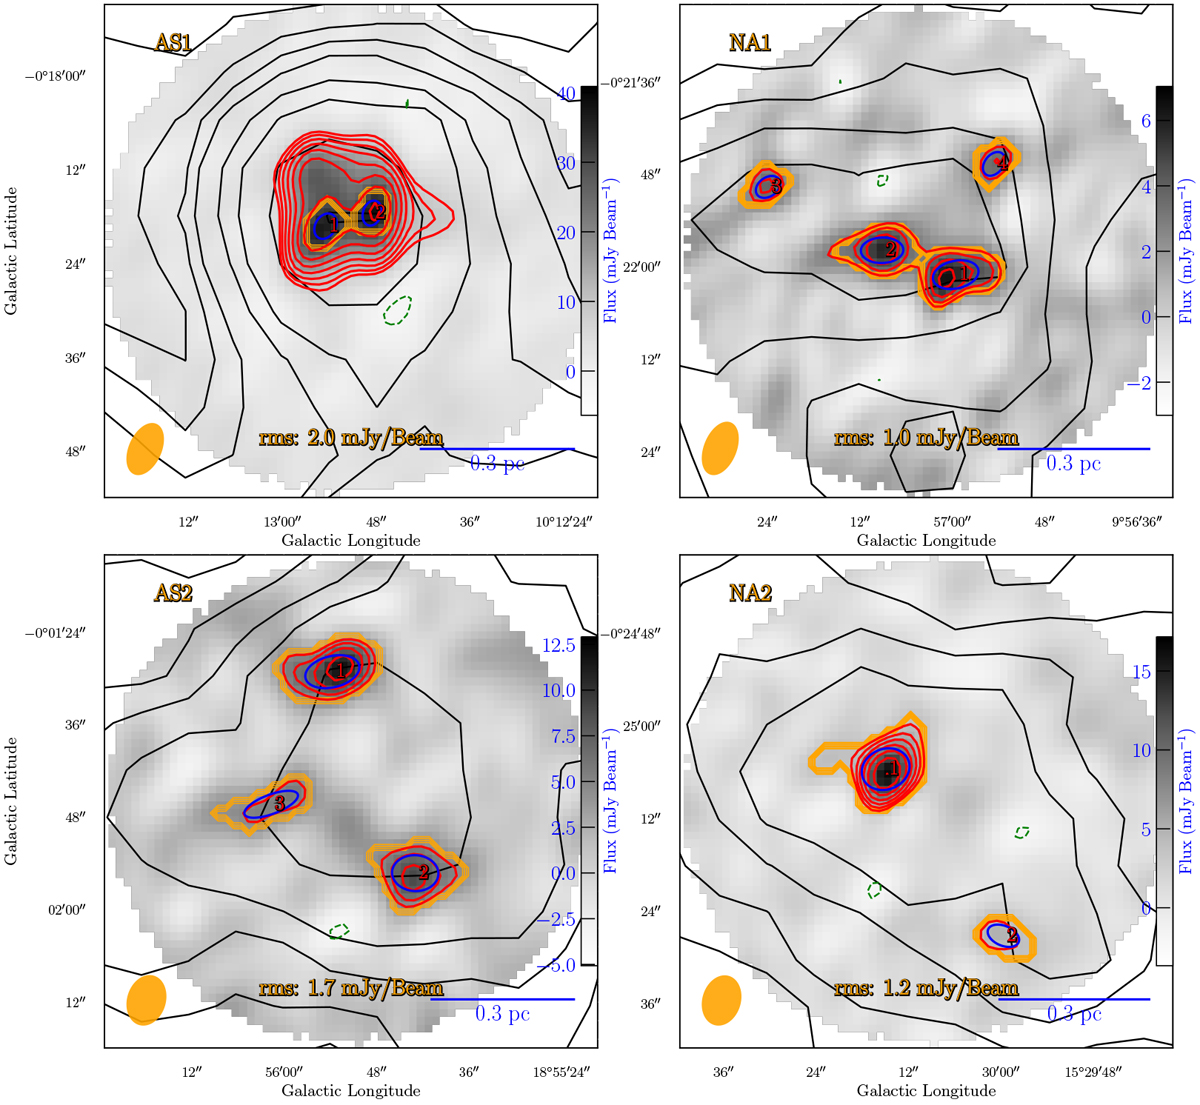
7 m ACA continuum images uncorrected for primary beam. ATLASGAL 870 μm emission is shown with black contours with levels the same as Fig. 1. Red (positive) and green (negative) contours show the 7 m ACA emission with levels of ± rms × [3, 31.25, 31.50, 31.75, 32.0, 32.25, 32.50, 32.75, 33.0]. Blue ellipses and orange contours indicate the leaves and their pixels derived by Astrodendro, respectively. The red numbers mark the ranking of leaves’ mass in Table A.3.
Current usage metrics show cumulative count of Article Views (full-text article views including HTML views, PDF and ePub downloads, according to the available data) and Abstracts Views on Vision4Press platform.
Data correspond to usage on the plateform after 2015. The current usage metrics is available 48-96 hours after online publication and is updated daily on week days.
Initial download of the metrics may take a while.