Fig. 15
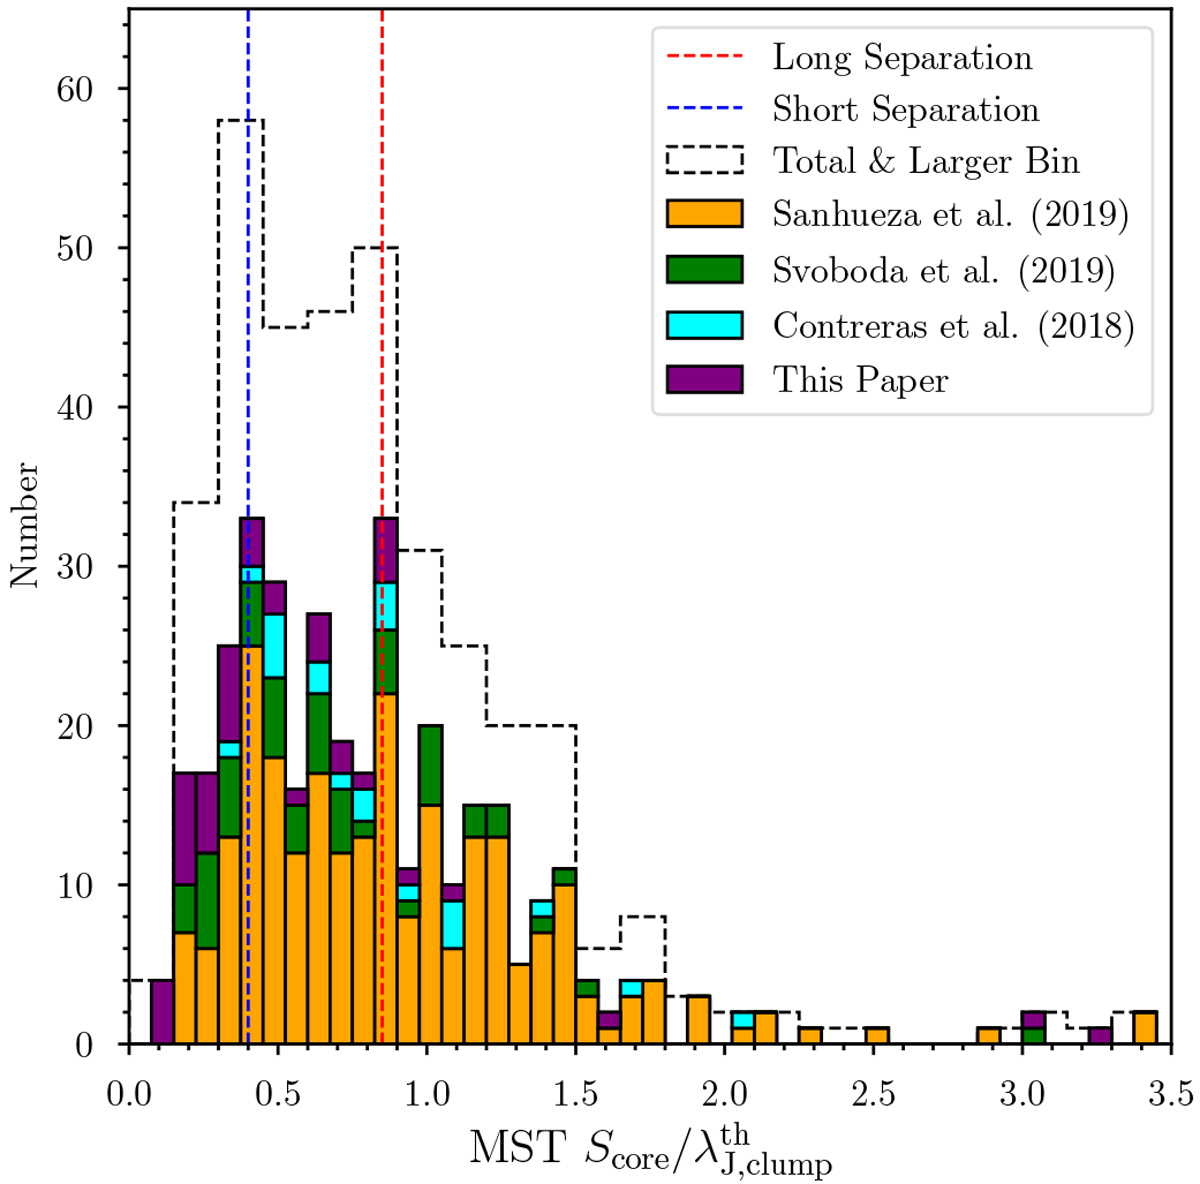
Statistics of core MST separations for 31 candidate HMSCs. The data have been taken from Contreras et al. (2018); Svoboda et al. (2019); Sanhueza et al. (2019), and from the sources in this paper. Clump properties for the candidate HMSCs in the single pointing mapping of Svoboda et al. (2019) are taken from Paper I when possible, to improve the consistency of the data. Therefore, the number distributions for the sources of Svoboda et al. (2019) here are slightly different from the raw ones. There are a total of 363 separations. The size of the bin is set to be 0.075 (color-filled histogram) and 0.15 (black-edge histogram) to avoid bias. Red and blue lines mark the two peaks of the distribution.
Current usage metrics show cumulative count of Article Views (full-text article views including HTML views, PDF and ePub downloads, according to the available data) and Abstracts Views on Vision4Press platform.
Data correspond to usage on the plateform after 2015. The current usage metrics is available 48-96 hours after online publication and is updated daily on week days.
Initial download of the metrics may take a while.