Fig. 14
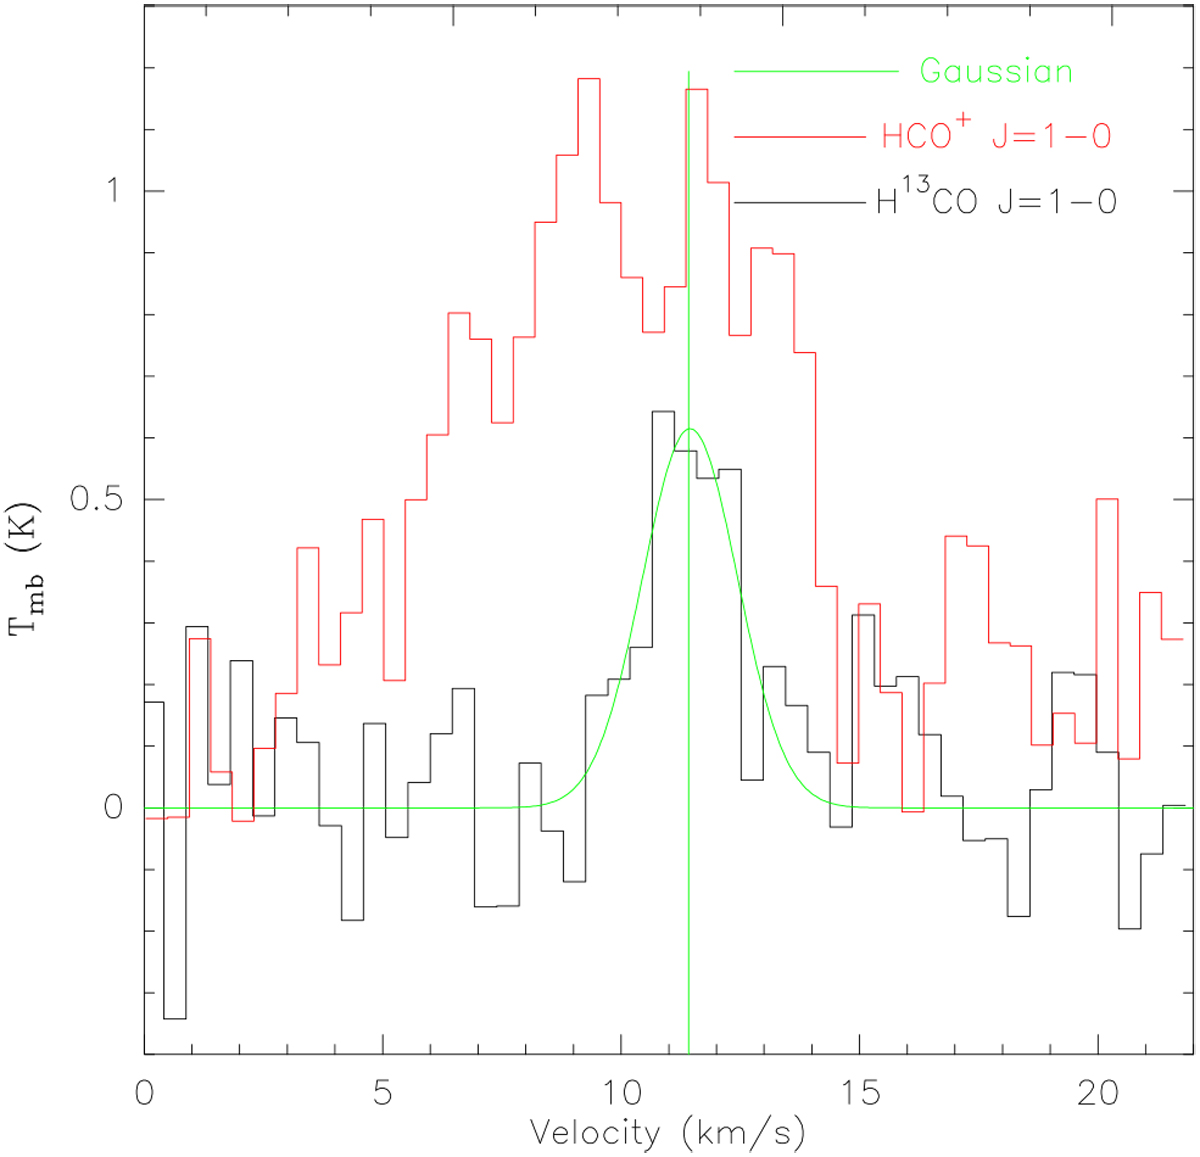
Single-dish spectra of AS1. Red and black spectra show the single-dish optically thick MALT90 HCO+ J = 1−0 and optically thin MALT90 H13CO+ J = 1−0 transitions, respectively. The spatial and velocity resolutions are 38′′ and 0.11 km s−1, respectively. To improve the depiction, the spectra have been regridded to 0.45 km s−1. Green lines are fitted Gaussian and its center.
Current usage metrics show cumulative count of Article Views (full-text article views including HTML views, PDF and ePub downloads, according to the available data) and Abstracts Views on Vision4Press platform.
Data correspond to usage on the plateform after 2015. The current usage metrics is available 48-96 hours after online publication and is updated daily on week days.
Initial download of the metrics may take a while.