Fig. 13
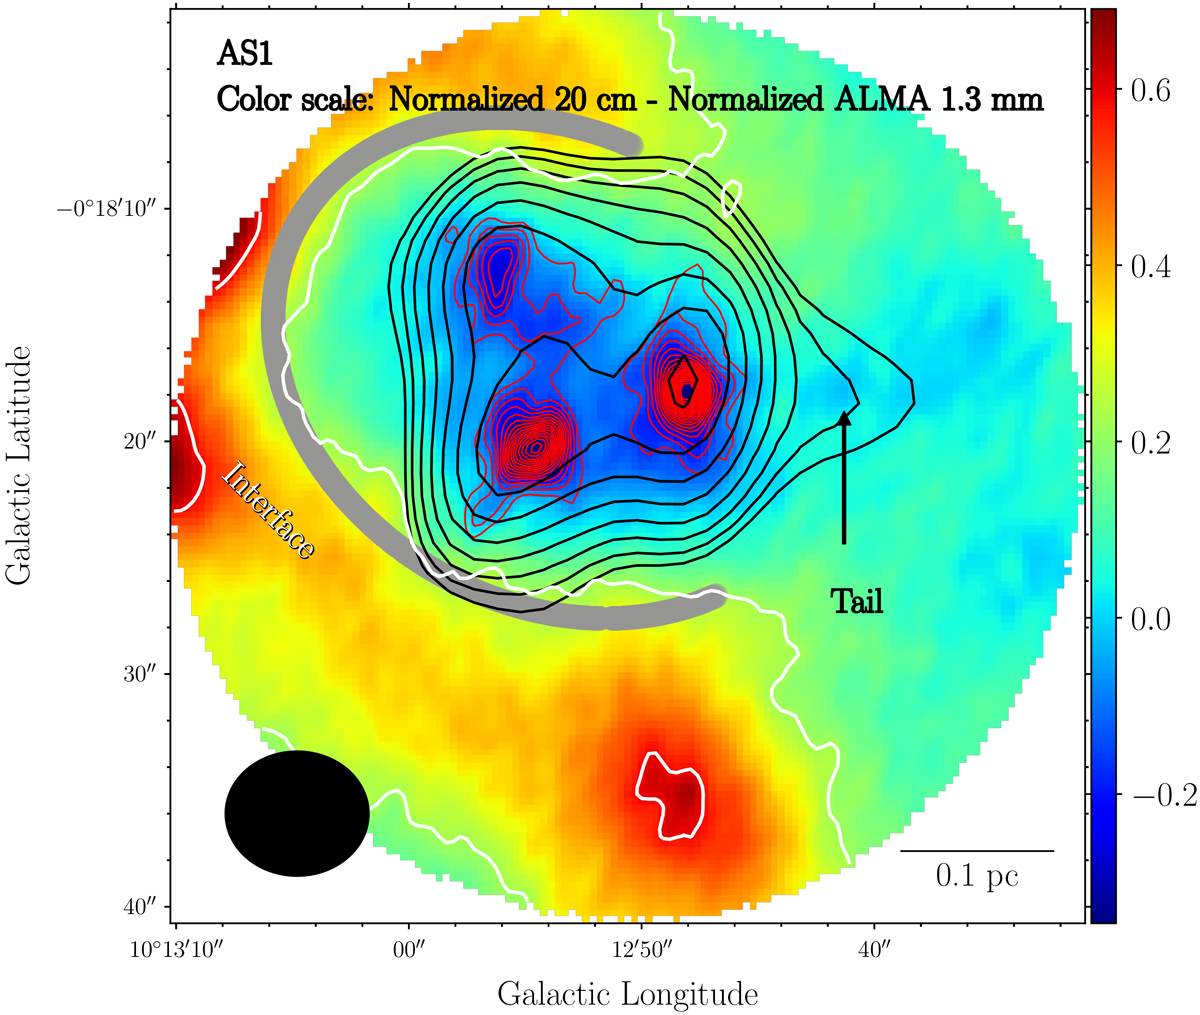
Normalized intensity of AS1. This map shows the value of normalized 20 cm intensity minus normalized 7 m + 12 m combined 1.3 mm continuum. White contours start from 3 rms with a step of 1 rms. The gray curve indicates the IF or the interface of interaction. Red and black contours represent the 7 m + 12 m combined and 7 m alone 1.3 mm continuum with the levels similar to Figs. 3 and 6, respectively.
Current usage metrics show cumulative count of Article Views (full-text article views including HTML views, PDF and ePub downloads, according to the available data) and Abstracts Views on Vision4Press platform.
Data correspond to usage on the plateform after 2015. The current usage metrics is available 48-96 hours after online publication and is updated daily on week days.
Initial download of the metrics may take a while.