Fig. 11
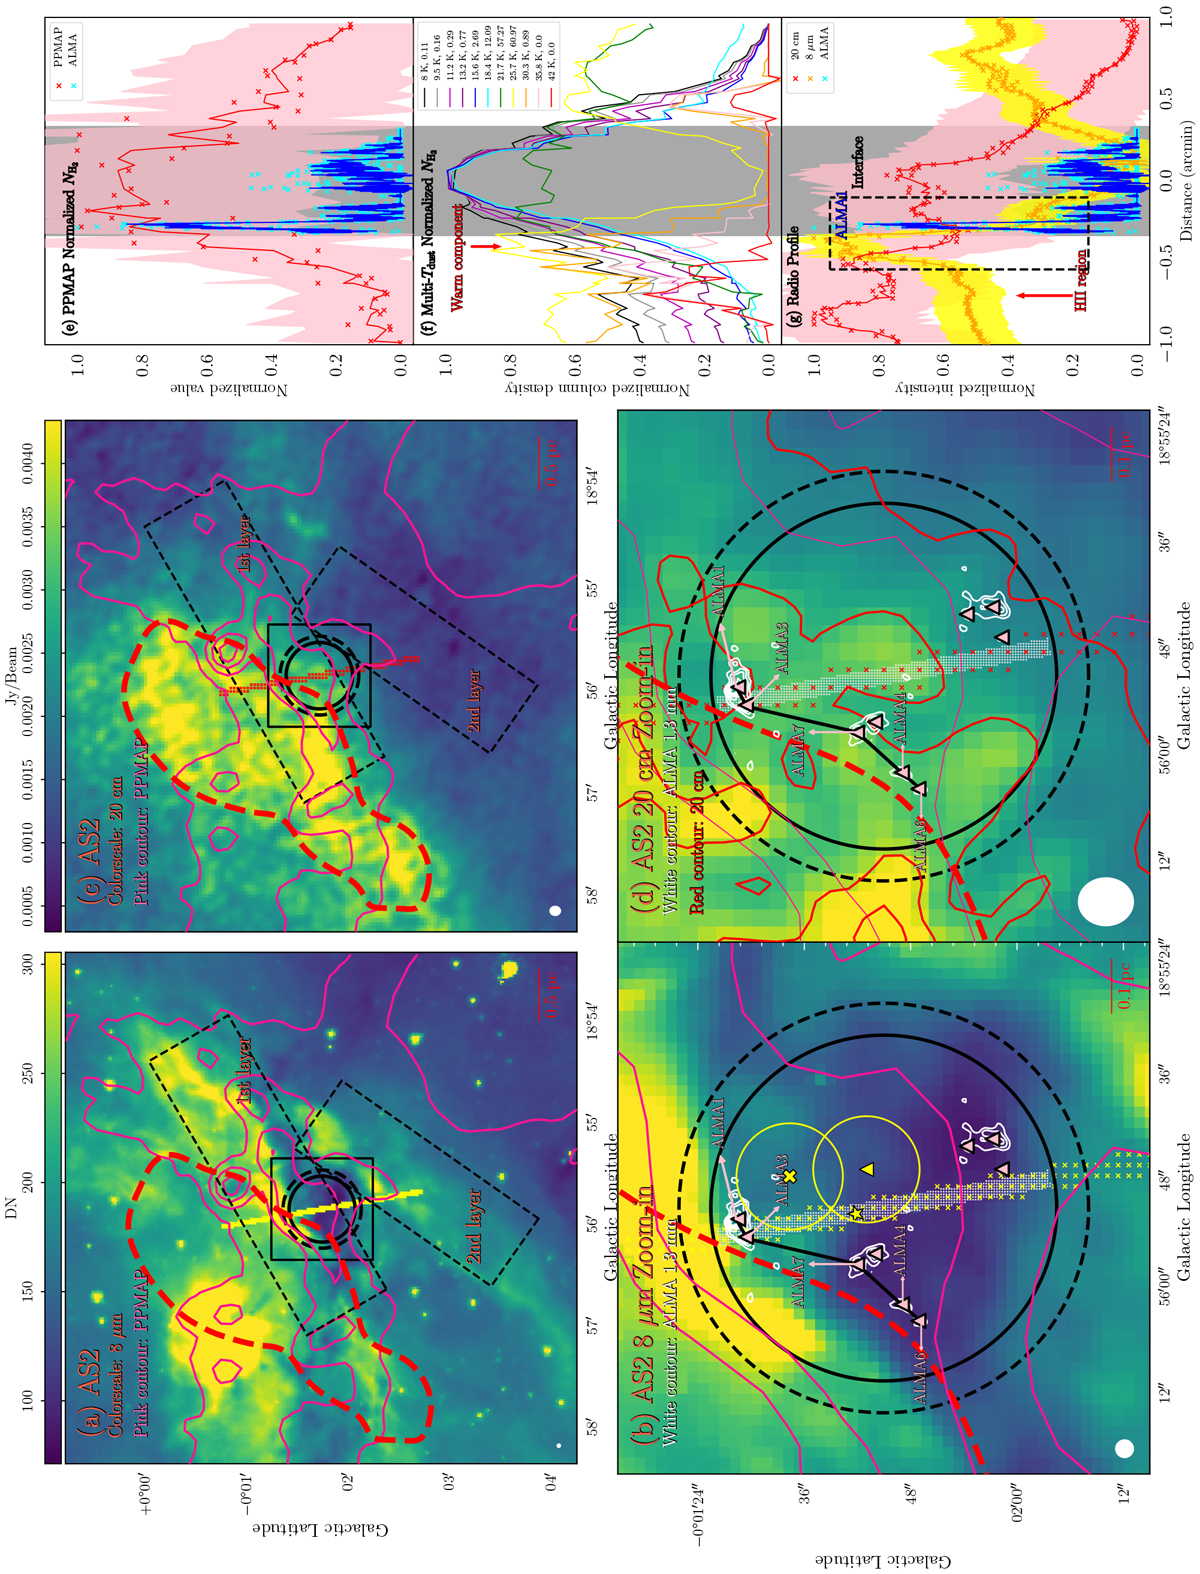
Impacted candidate HMSC AS2. Panel a: 8 μm emission. The pink contours have the same meanings as in panel a of Fig. 10. Black dashed rectangles indicate two PDRs. The red dashed contour shows the smoothed 20 cm continuum with a level of 3.3 rms. The yellow bar marks the pixels used to create the intensity profile. Panel b: close view of panel a, overlaid with 7 m + 12 m combined 1.3 mm continuum contours (white) starting from 3 rms with a step of 1 rms. Black solid and dashed circles represent the 7 m + 12 m combined fields of view cut at 20 and 10% power points of primary beam, respectively. The white bar shows the pixels used for ALMA 1.3 mm profile. The light pink triangles mark the ALMA cores. The lines connecting ALMA1, 3, 7, 4, and 6 indicate a wall-like morphology. The yellow star, cross (large), triangle, and circles are similar to Fig. 10. Panel c: 20 cm continuum. The red bar indicates the pixels used to show intensity profile. Panel d: closer view of panel c. The red solid contours indicate the 20 cm continuum with levels starting from 2 rms with a step of 1 rms. Panels e–g are similar in content to Fig. 10.
Current usage metrics show cumulative count of Article Views (full-text article views including HTML views, PDF and ePub downloads, according to the available data) and Abstracts Views on Vision4Press platform.
Data correspond to usage on the plateform after 2015. The current usage metrics is available 48-96 hours after online publication and is updated daily on week days.
Initial download of the metrics may take a while.