Fig. 10
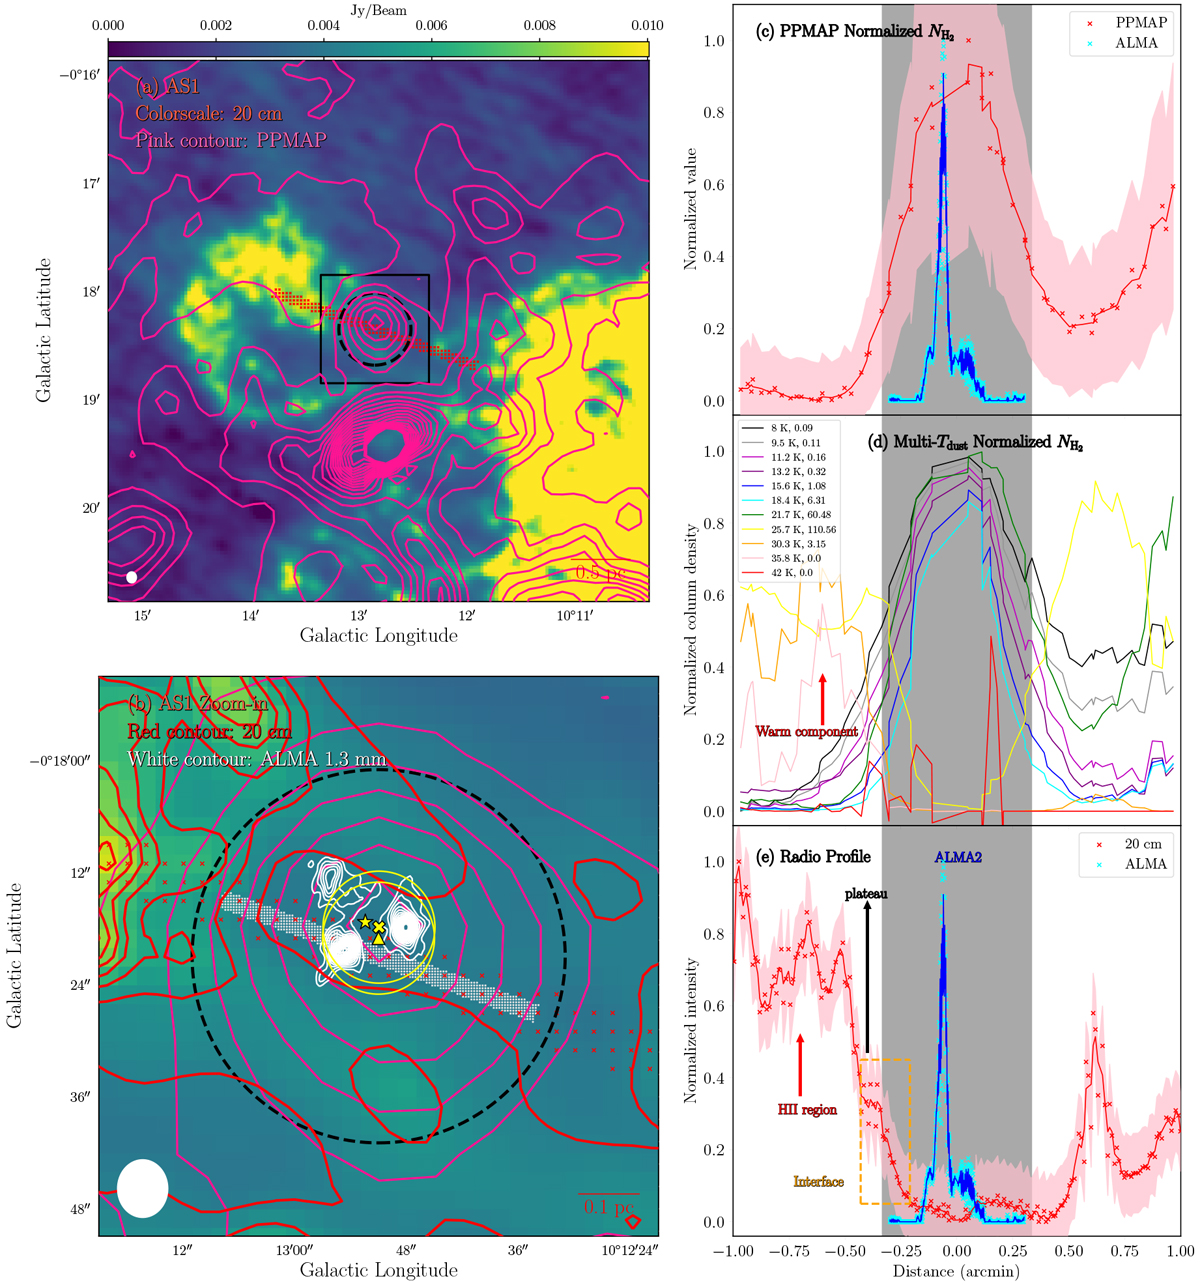
Impacted candidate HMSC AS1. Panel a: large-scale 20 cm continuum overlaid with the Hi-GAL PPMAP ![]() contours starting from 1022 cm−2 with a step of 1022 cm−2. The red bar indicates the pixels used to create intensity profile. Panel b: closer view of the black box in panel a, overlaid with 7 m +12 m combined 1.3 mm emission contours (white) starting from 3 rms with a step of 1 rms. The 20 cm continuum is indicated by red contours starting from 3 rms with a step of 1 rms. The black dashed circle indicates the field of view (20% power point) of the 1.3 mm image. The white bar indicates the pixels used for ALMA intensity profile. The yellow star, cross, and triangle are similar to those in Figs. 3 and 4, but for the PPMAP
contours starting from 1022 cm−2 with a step of 1022 cm−2. The red bar indicates the pixels used to create intensity profile. Panel b: closer view of the black box in panel a, overlaid with 7 m +12 m combined 1.3 mm emission contours (white) starting from 3 rms with a step of 1 rms. The 20 cm continuum is indicated by red contours starting from 3 rms with a step of 1 rms. The black dashed circle indicates the field of view (20% power point) of the 1.3 mm image. The white bar indicates the pixels used for ALMA intensity profile. The yellow star, cross, and triangle are similar to those in Figs. 3 and 4, but for the PPMAP ![]() . Yellow circles and white ellipse indicate the PPMAP and cm continuum beams, respectively. Panel c: normalized PPMAP
. Yellow circles and white ellipse indicate the PPMAP and cm continuum beams, respectively. Panel c: normalized PPMAP ![]() and the 7 m + 12 m combined 1.3 mm intensity profiles cut along the direction indicated in panels a and b. The gray region highlights the ALMA imaging field. Panel d: normalized profiles of
and the 7 m + 12 m combined 1.3 mm intensity profiles cut along the direction indicated in panels a and b. The gray region highlights the ALMA imaging field. Panel d: normalized profiles of ![]() with different Tdust derived by PPMAP. The numbers after Tdust values in the legend are the S/N of the corresponding profiles. The S/N is set to be zero when < 0.01. Panel e: 20 cm emission profile. The H II region, interface, and plateau are indicated by different labels.
with different Tdust derived by PPMAP. The numbers after Tdust values in the legend are the S/N of the corresponding profiles. The S/N is set to be zero when < 0.01. Panel e: 20 cm emission profile. The H II region, interface, and plateau are indicated by different labels.
Current usage metrics show cumulative count of Article Views (full-text article views including HTML views, PDF and ePub downloads, according to the available data) and Abstracts Views on Vision4Press platform.
Data correspond to usage on the plateform after 2015. The current usage metrics is available 48-96 hours after online publication and is updated daily on week days.
Initial download of the metrics may take a while.