Fig. 1
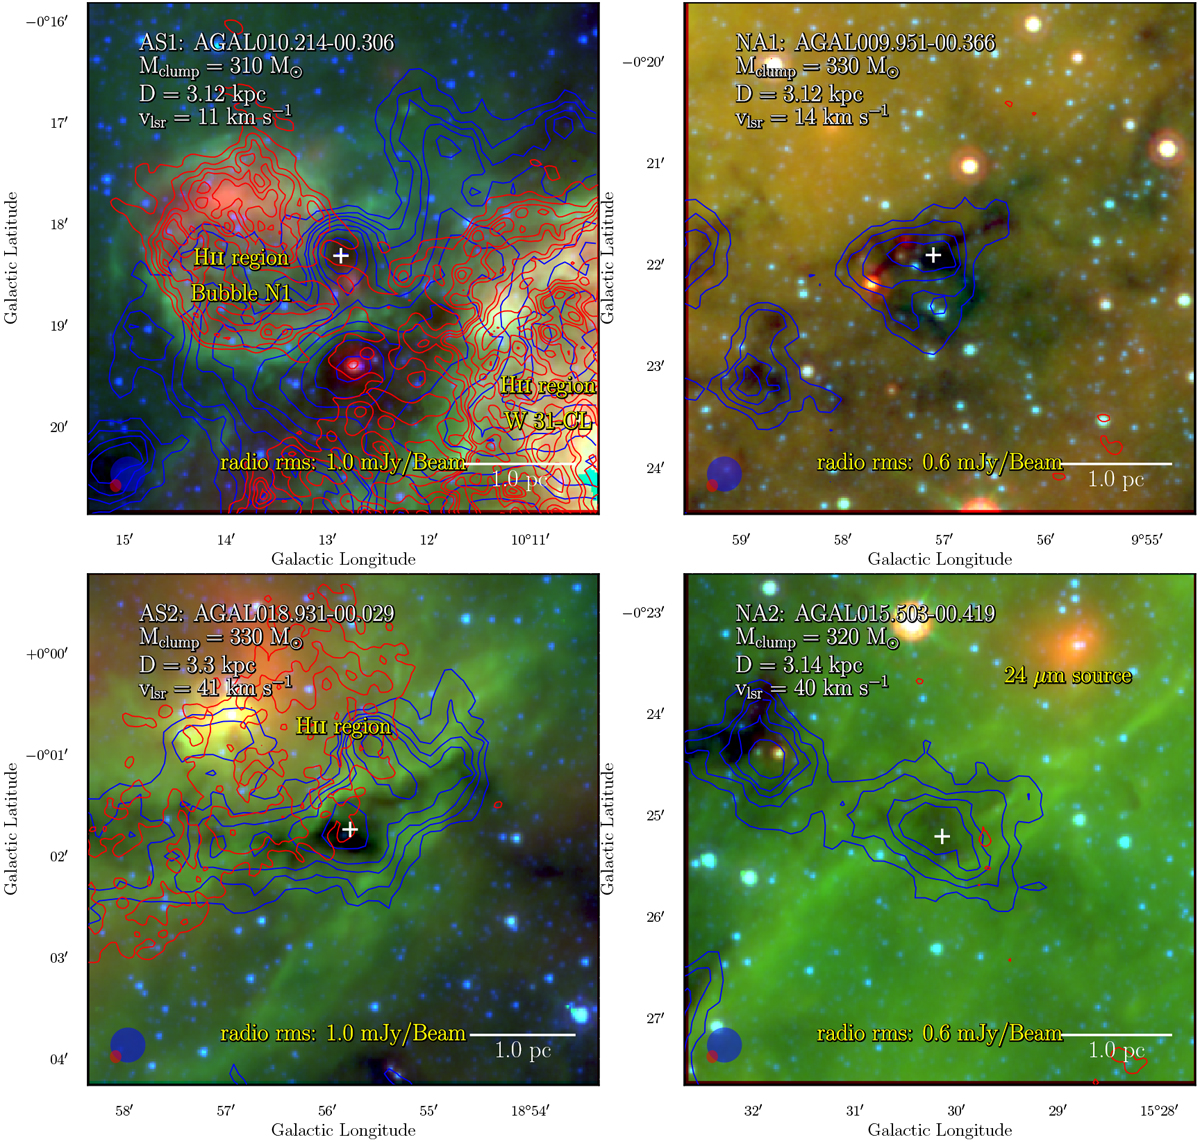
Environment of candidate HMSCs. Each panel shows ATLASGAL 870 μm contours (blue, levels are [0.2, 0.3, 0.4, 0.5, 0.7, 0.9, 1.3, 1.8, 2.5, 4] Jy Beam−1) overlaid on RGB images constructed from Spitzer 24 μm (in red), 8 μm (in green), and 4.5 μm (in blue) images. The candidate HMSCs are indicated by white crosses. Red contours indicate radio continuum emission, which are MAGPIS 20 cm for most of the regions except for NA3 and AS4 (MAGPIS 90 cm and SUMSS 35 cm, respectively; see Fig. 2.). The root mean square (rms) of the radio images are indicated in the bottom center of each panel. The radio contour levels are the radio image rms × [3, 4, 6, 8, 10, 15, 20, 30, 40, 60, 80]. The beams of radio and ATLASGAL images are shown in bottom left by red and blue ellipses, respectively. The used survey data include the: Galactic Legacy Infrared Mid-Plane Survey Extraordinaire (GLIMPSE, Churchwell et al. 2009); Multiband Imaging Photometer Galactic Plane Survey (MIPSGAL, Carey et al. 2009); Multi-Array Galactic Plane Imaging Survey (MAGPIS, Helfand et al. 2006), and Sydney University Molonglo Sky Survey (SUMSS, Bock et al. 1999).
Current usage metrics show cumulative count of Article Views (full-text article views including HTML views, PDF and ePub downloads, according to the available data) and Abstracts Views on Vision4Press platform.
Data correspond to usage on the plateform after 2015. The current usage metrics is available 48-96 hours after online publication and is updated daily on week days.
Initial download of the metrics may take a while.