Fig. 6.
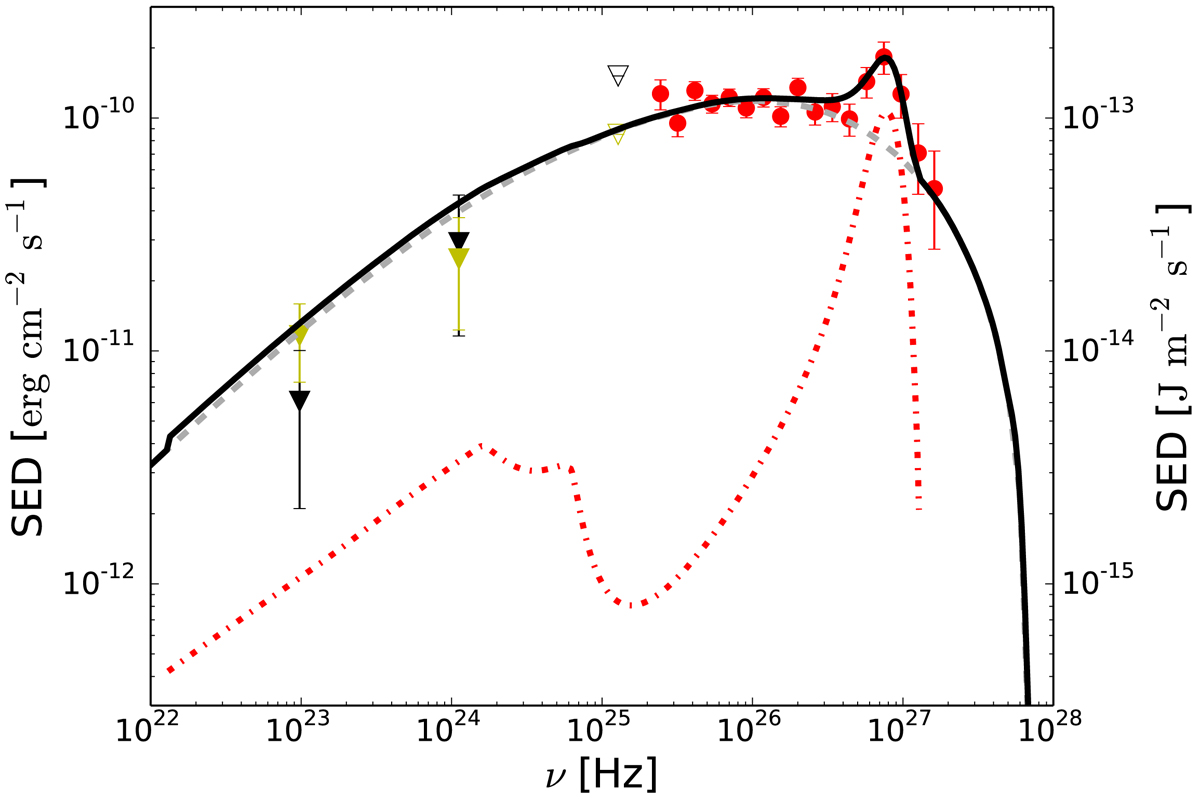
High-energy bump of the SED of Mrk 501 from 2014 July 19 (MJD 56857.98). The dashed grey line depicts the IC bump of a one-zone SSC model (contribution FSSC). The dot-dashed red line depicts the emission of the cascade (contribution Fcasc, cf. green line in Fig. 5). The sum F of both contributions is depicted by the solid black line. The spectral data from the MAGIC telescopes are shown as red circles, while measurements and upper limits by the Fermi Large Area Telescope are drawn by black and yellow triangles. The details on the data analysis and the SSC modelling can be found in MAGIC Collaboration (2020).
Current usage metrics show cumulative count of Article Views (full-text article views including HTML views, PDF and ePub downloads, according to the available data) and Abstracts Views on Vision4Press platform.
Data correspond to usage on the plateform after 2015. The current usage metrics is available 48-96 hours after online publication and is updated daily on week days.
Initial download of the metrics may take a while.