Free Access
Fig. 9.
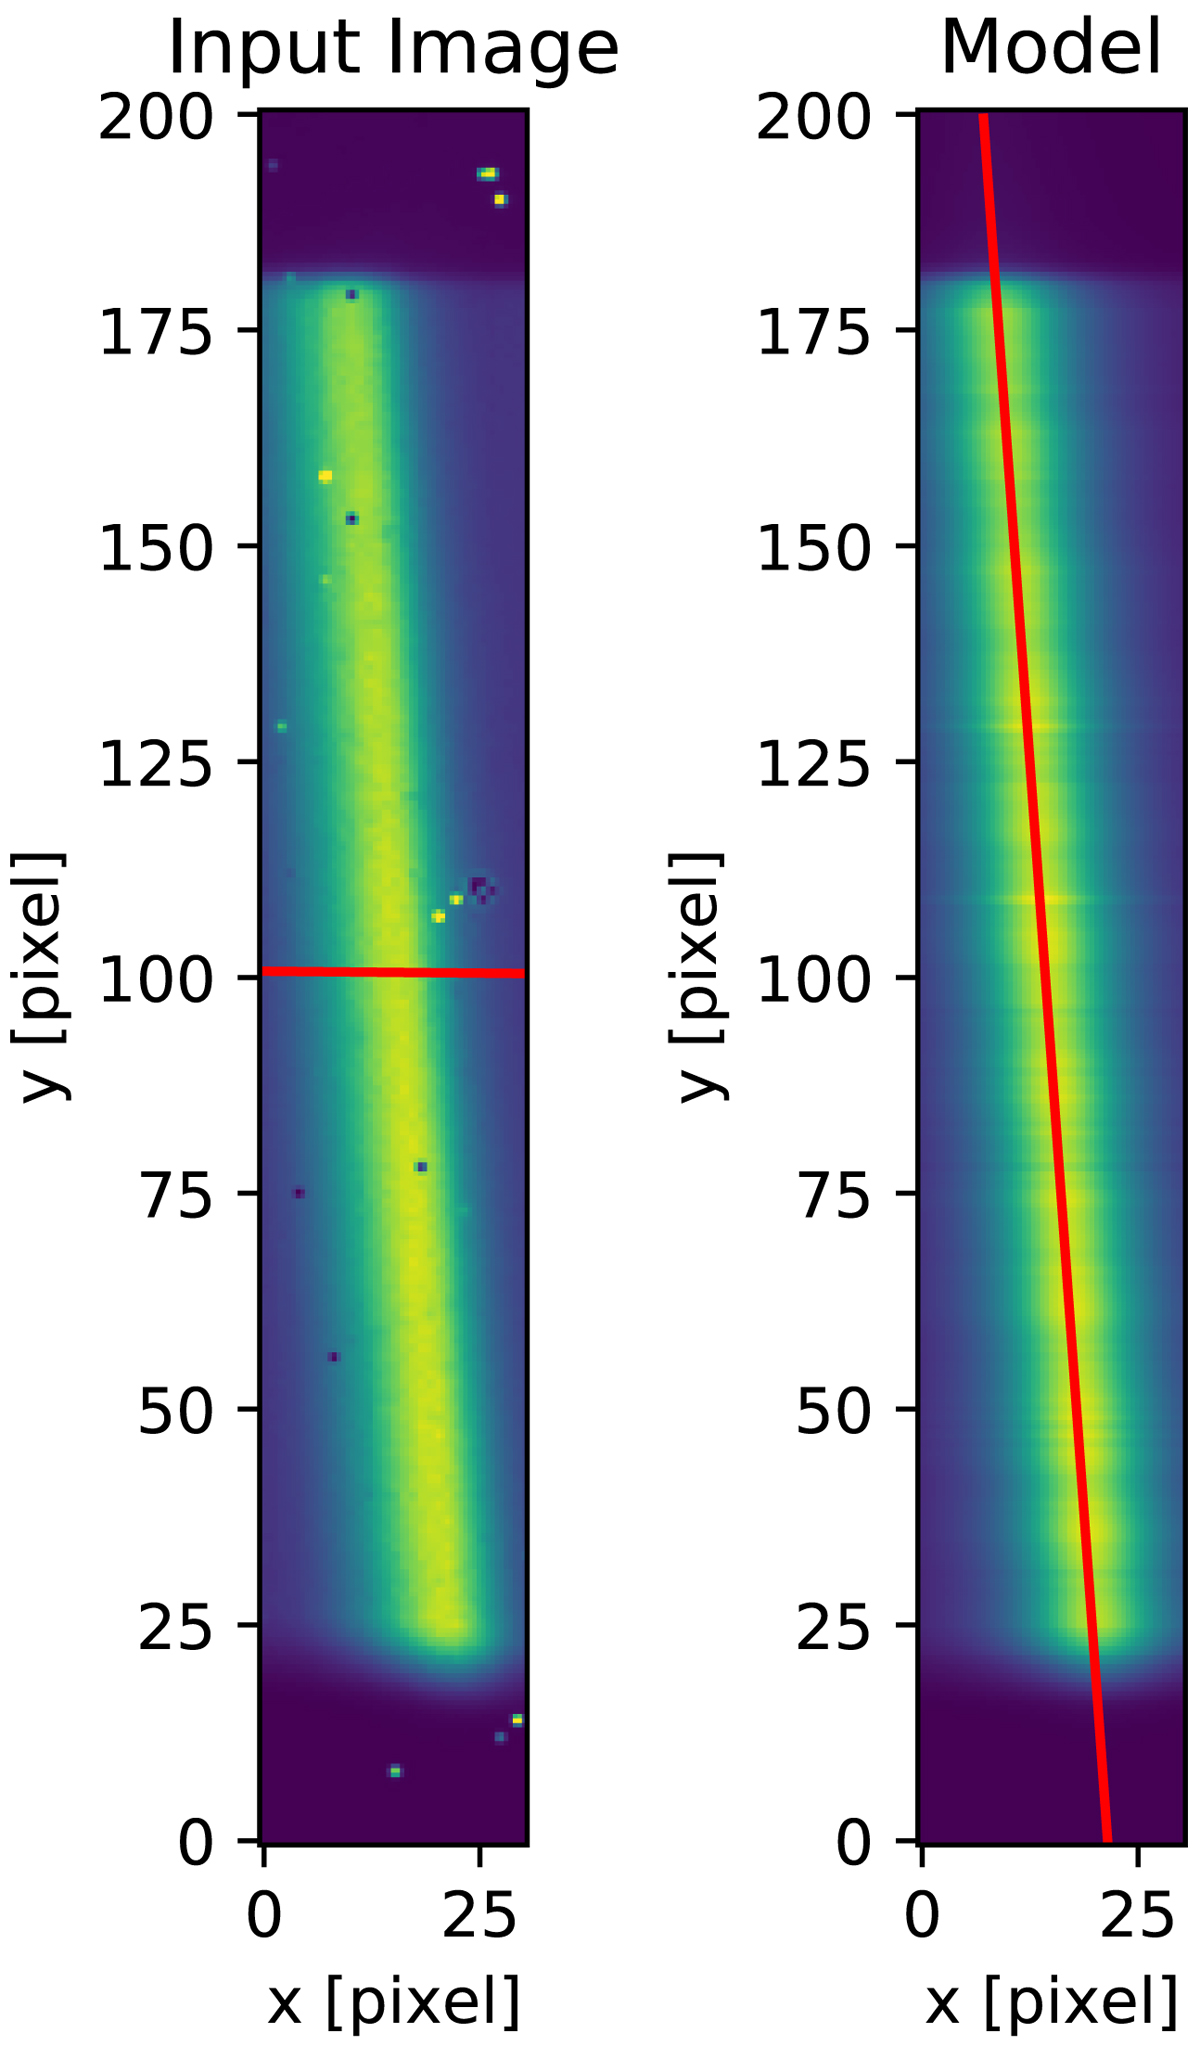
Curvature estimation for one spectral line. Left: rectified input image cut out from the wavelength calibration frame. The order trace yc(x) is marked in red. Right: best-fit model image. The extracted tilt is marked in red. We only fit a linear tilt here. Data come from ESO/CRIRES+ Fabry-Pérot interferometer.
Current usage metrics show cumulative count of Article Views (full-text article views including HTML views, PDF and ePub downloads, according to the available data) and Abstracts Views on Vision4Press platform.
Data correspond to usage on the plateform after 2015. The current usage metrics is available 48-96 hours after online publication and is updated daily on week days.
Initial download of the metrics may take a while.