Fig. 8.
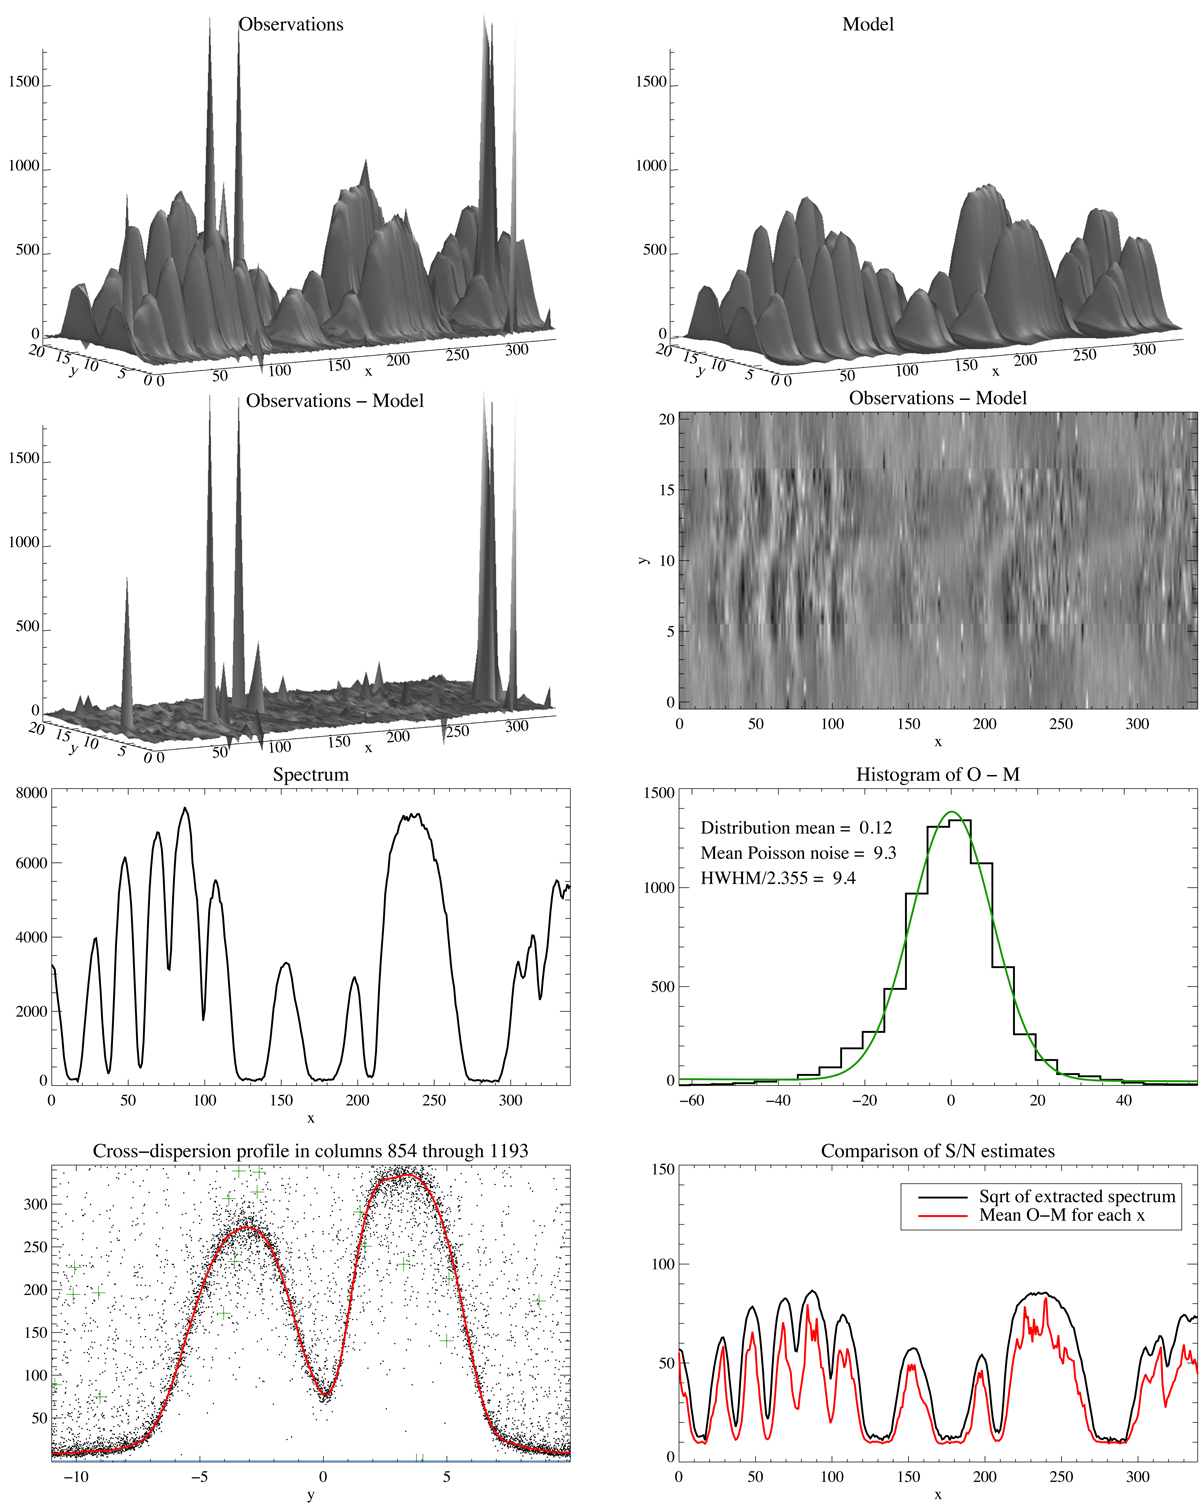
Slit decomposition uncertainties. The top four panels show the 2D image of the data as registered by CARMENES (Ex, y in equations), the model reconstructed using the deduced P and L functions (Sx, y) and their difference. The difference image on the right of the 2nd row was multiplied by the bad pixel mask constructed during the decomposition and shows residual ripples with an amplitude of ∼12.5 counts. The next four panels show the recovered spectrum (P) and slit illumination function (L) on the left. Scattered dots are the actual data points aligned with the order centre and divided by the extracted spectrum. Green pluses show rejected (masked) pixels. The right panels compare uncertainty estimates assuming Poisson statistics for the whole swath (histogram) as well as for each column (right panel in the second row from the bottom). The latter compares S/N for each column x based on the shot noise only and on the observations-model discrepancy. The bottom panel compares our extraction (in green) with the standard CARMENES pipeline (in black). The black line was shifted to the right by 1 pixel for visibility.
Current usage metrics show cumulative count of Article Views (full-text article views including HTML views, PDF and ePub downloads, according to the available data) and Abstracts Views on Vision4Press platform.
Data correspond to usage on the plateform after 2015. The current usage metrics is available 48-96 hours after online publication and is updated daily on week days.
Initial download of the metrics may take a while.