Fig. 7.
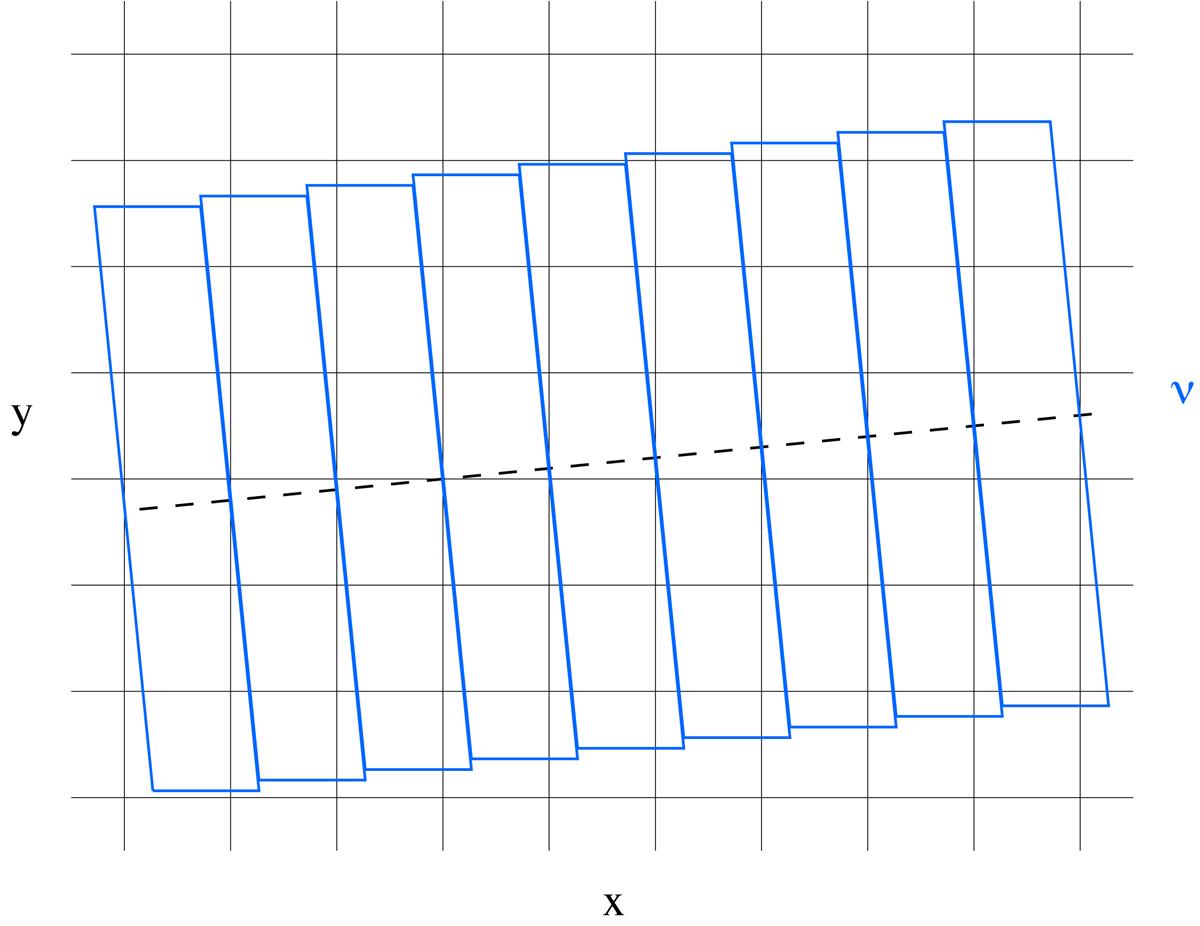
Schematic view of ‘ideal’ monochromatic images of a slit projected onto a detector by a non-Littrow spectrometer. Black squares represent spectrometer pixels. The dashed line traces the centre of a spectral order and the blue boxes show the idealised footprints of slit images. We note that by design the centre of the spectral order and the sides of a slit image intersect at the pixel column boundaries of the detector.
Current usage metrics show cumulative count of Article Views (full-text article views including HTML views, PDF and ePub downloads, according to the available data) and Abstracts Views on Vision4Press platform.
Data correspond to usage on the plateform after 2015. The current usage metrics is available 48-96 hours after online publication and is updated daily on week days.
Initial download of the metrics may take a while.