Fig. 3.
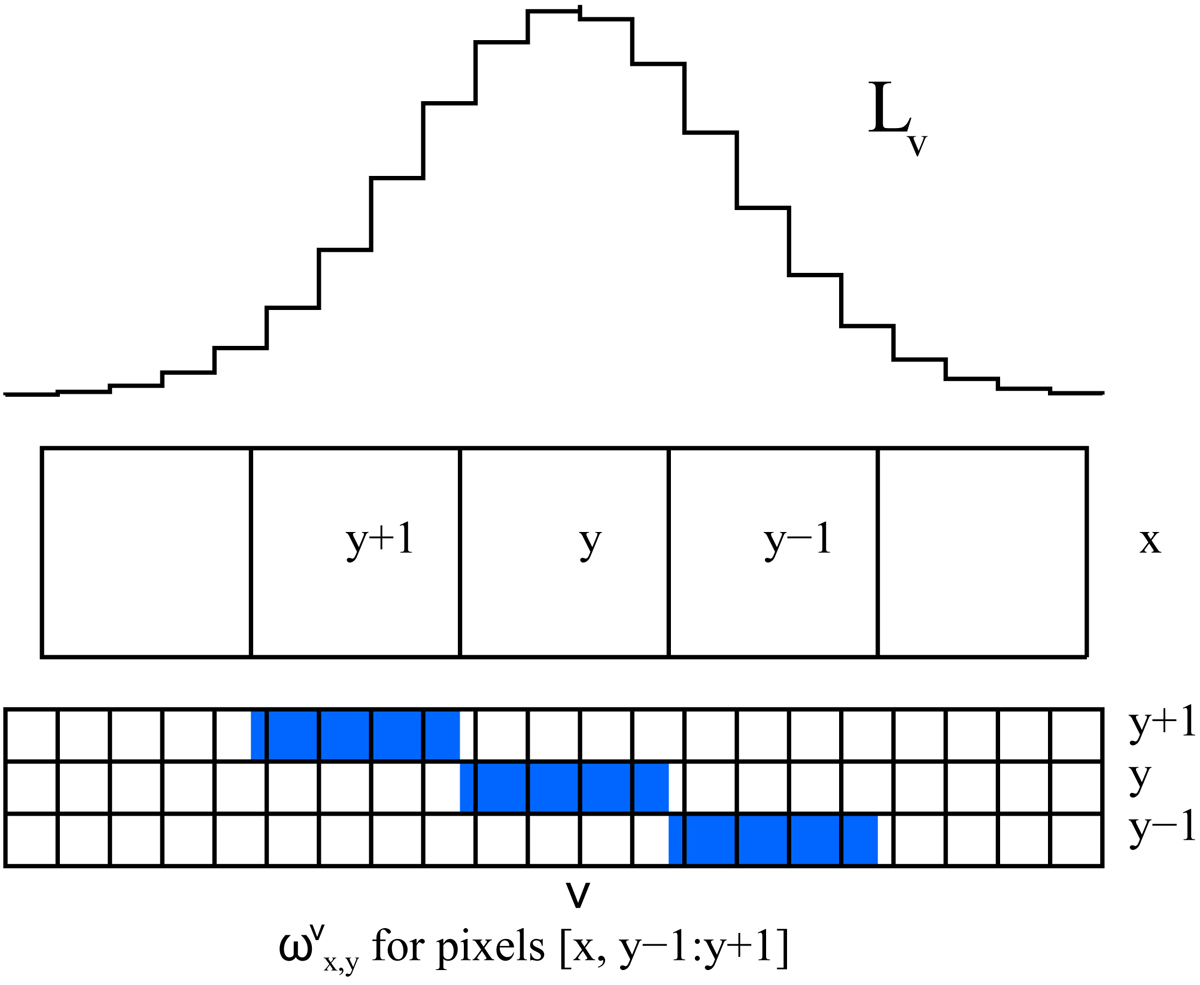
Schematic presentation of the subgrid sampling of the slit illumination function L and the corresponding structure of the ω tensor. On the top is an example of a slit illumination function aligned for column x. L is set on a subpixel scale v (shown at the bottom panel) that may shift relative to the detector pixels from one column to the next. For three pixels in this column centred at row y we show the structure of the corresponding section of ![]() . The fraction of each subpixel filled with blue is proportional to the value of the corresponding element of ω.
. The fraction of each subpixel filled with blue is proportional to the value of the corresponding element of ω.
Current usage metrics show cumulative count of Article Views (full-text article views including HTML views, PDF and ePub downloads, according to the available data) and Abstracts Views on Vision4Press platform.
Data correspond to usage on the plateform after 2015. The current usage metrics is available 48-96 hours after online publication and is updated daily on week days.
Initial download of the metrics may take a while.