Fig. 18.
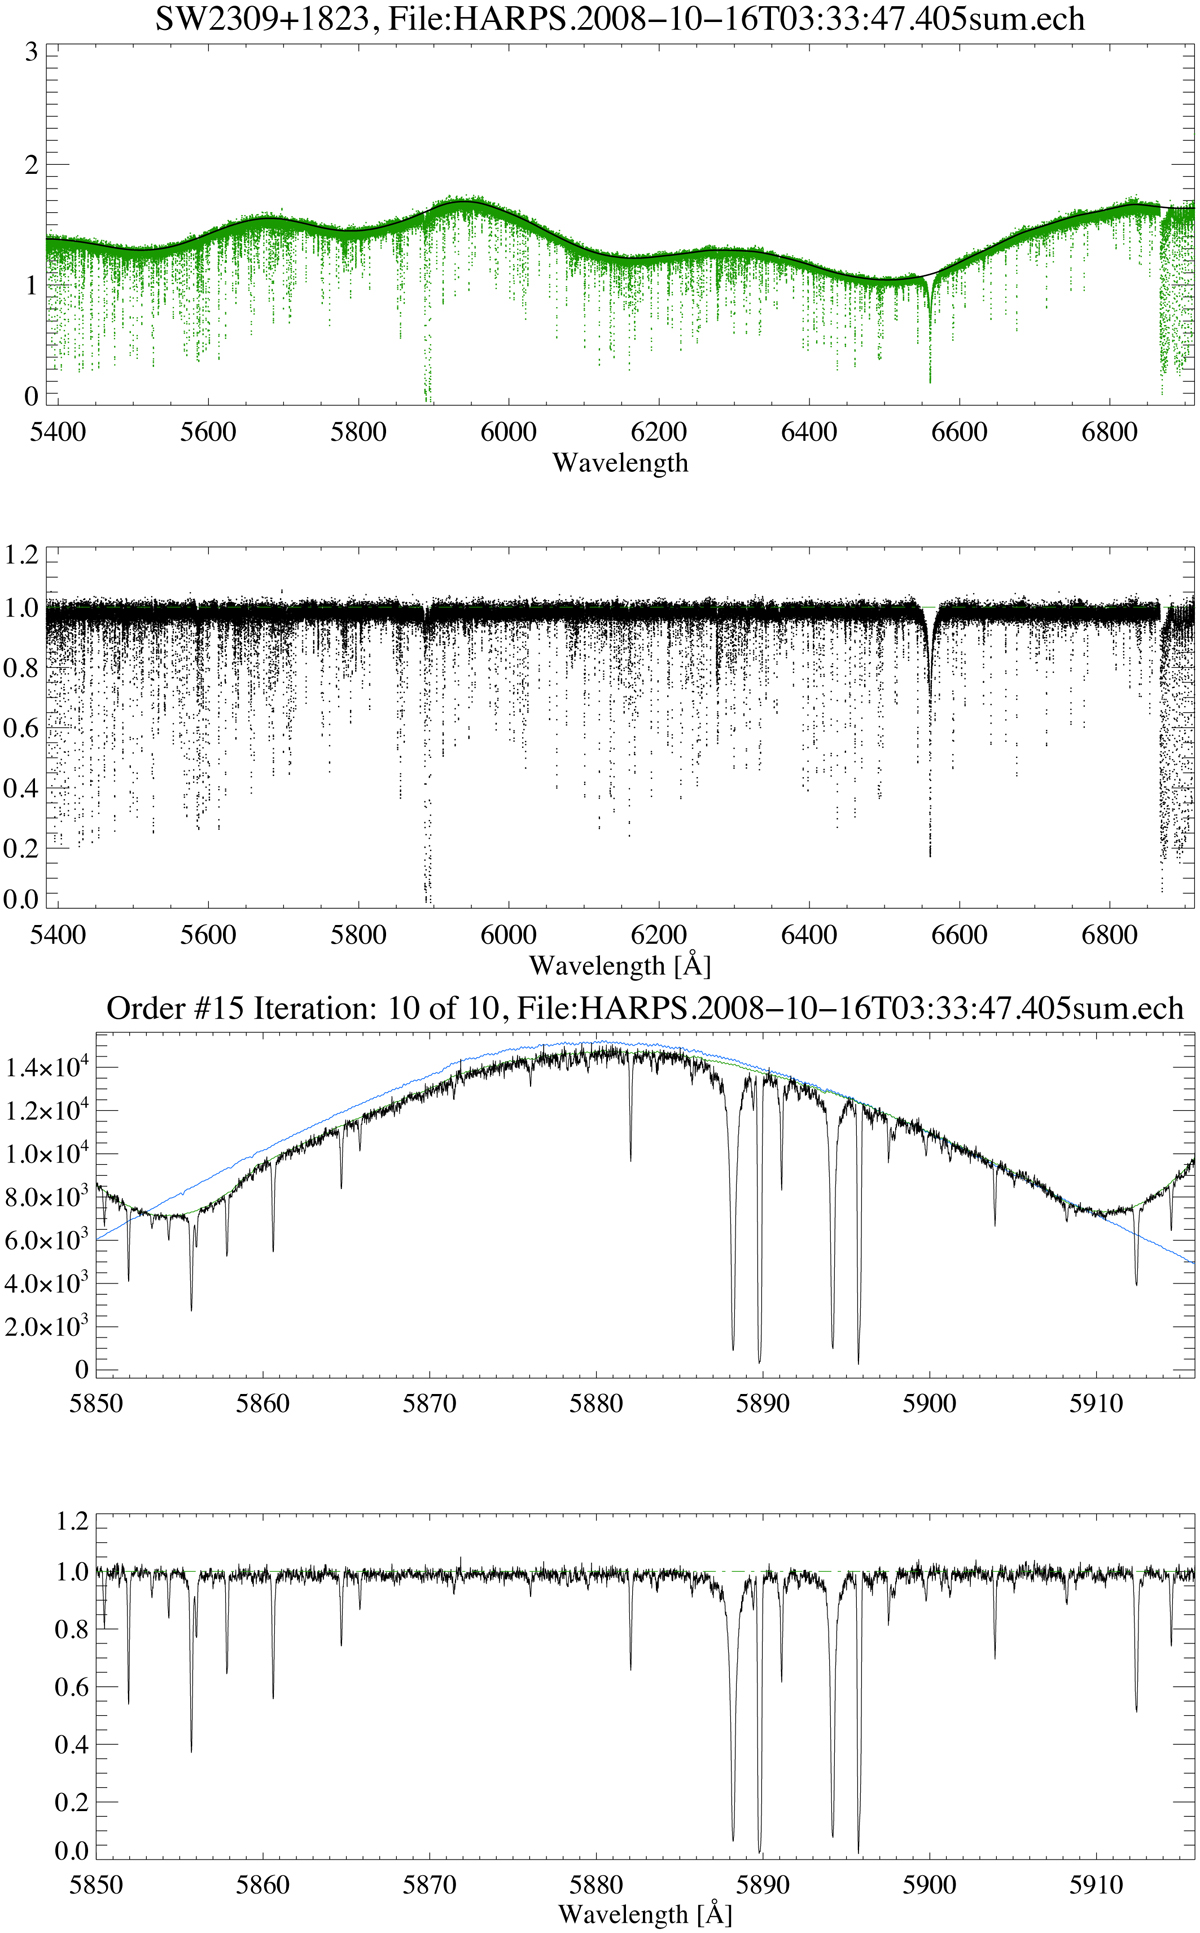
Final result of the continuum fitting. Top: spliced spectrum is shown in green while the continuum is in black. Second panel: continuum-normalised spectrum. Two bottom panels: zoom on order #15 (absolute order 103). Third panel from the top: spliced spectrum is in black, the original (non-spliced) blaze function is in blue and the continuum fit is in green. The continuum-normalised order is shown in the bottom panel. Example comes from the red detector of La Silla/HARPS.
Current usage metrics show cumulative count of Article Views (full-text article views including HTML views, PDF and ePub downloads, according to the available data) and Abstracts Views on Vision4Press platform.
Data correspond to usage on the plateform after 2015. The current usage metrics is available 48-96 hours after online publication and is updated daily on week days.
Initial download of the metrics may take a while.