Fig. 17.
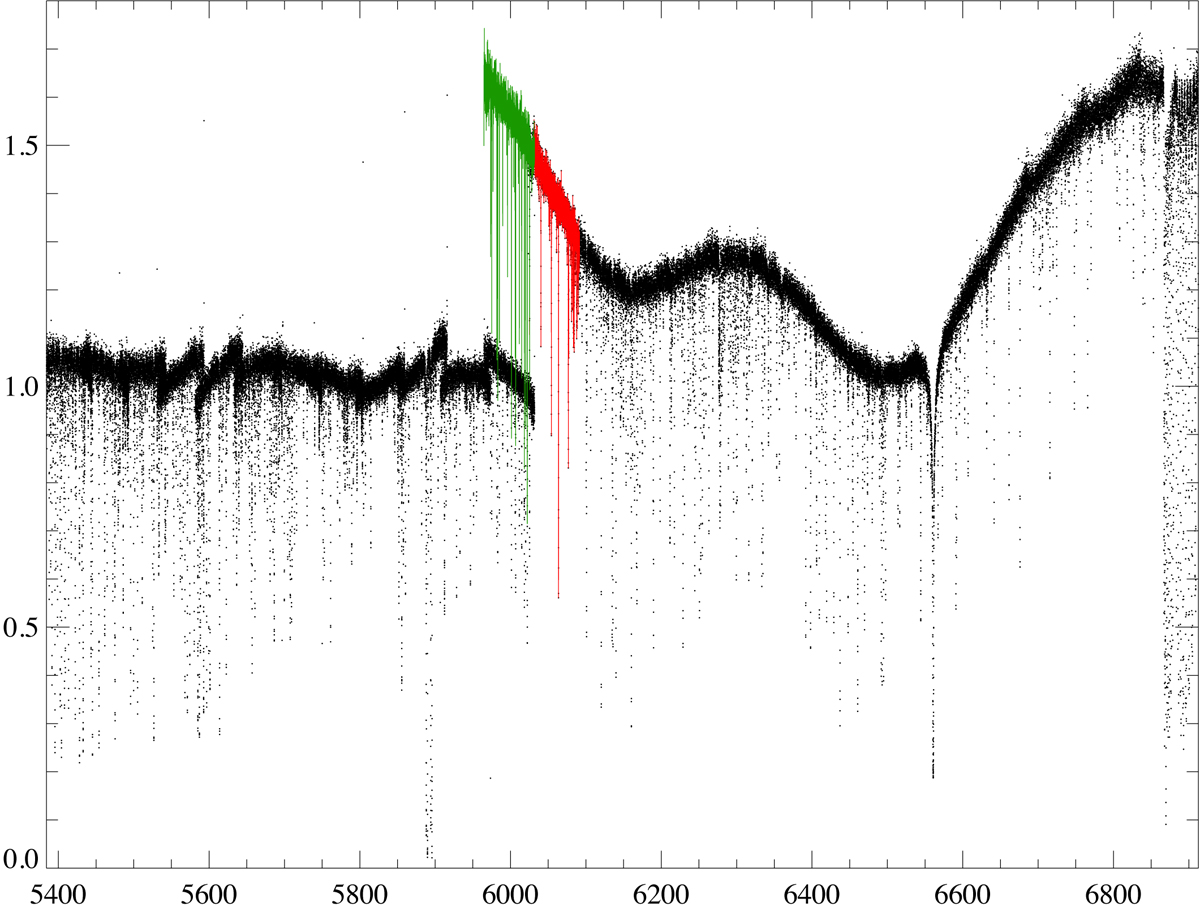
Example of the spectral order splicing using the common wavelength scale. Before splicing we divide the signal by the blaze function derived from the flat field. We start from the order with the highest S/N, scale adjacent orders to achieve the best match in the overlap region and co-add the data with linear weights to avoid discontinuities. The black region to the right is already spliced. The scaling of the next order in line is shown in green. The scaled overlap region is shown in red. This example comes from the red detector of La Silla/HARPS.
Current usage metrics show cumulative count of Article Views (full-text article views including HTML views, PDF and ePub downloads, according to the available data) and Abstracts Views on Vision4Press platform.
Data correspond to usage on the plateform after 2015. The current usage metrics is available 48-96 hours after online publication and is updated daily on week days.
Initial download of the metrics may take a while.