Free Access
Fig. 16.
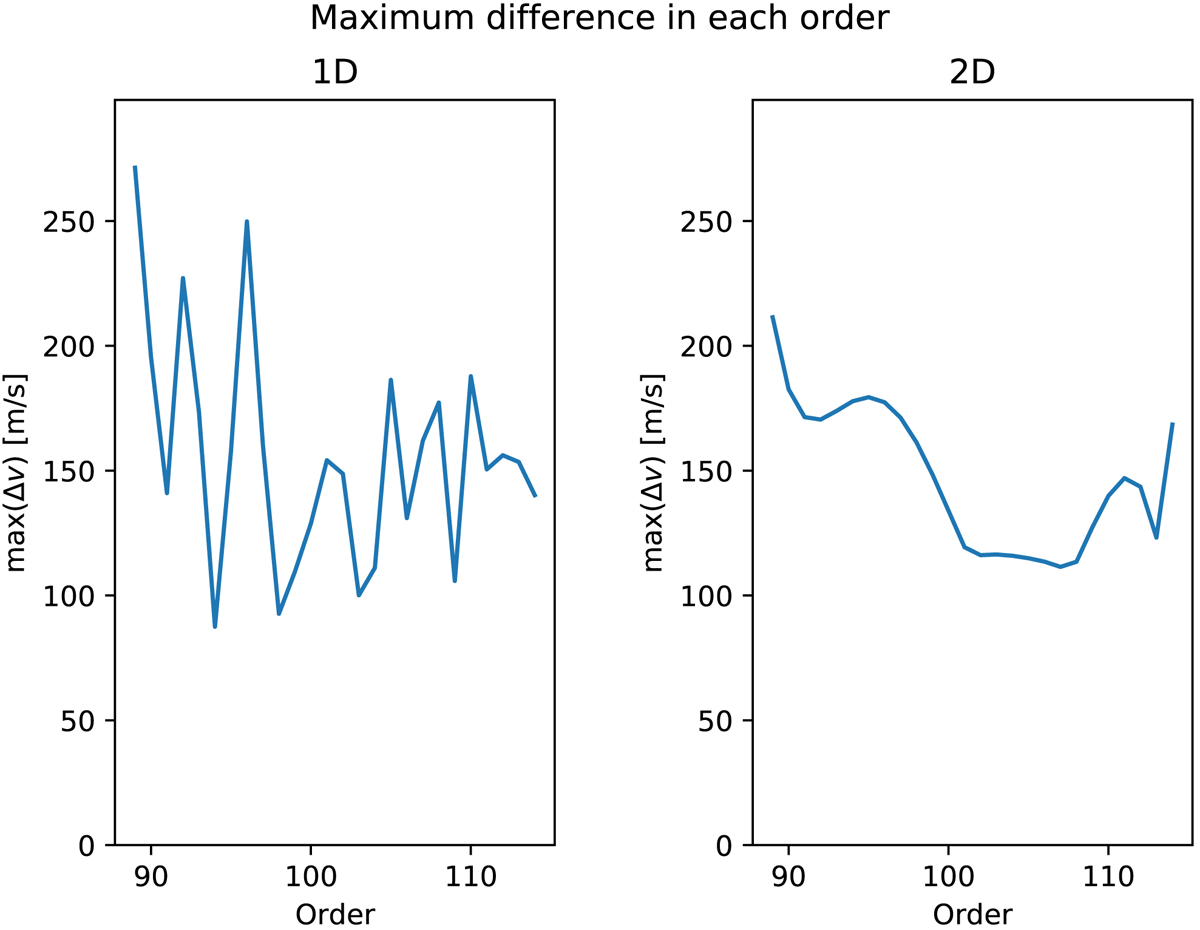
Maximum difference between the ThAr wavelength solution and the LFC wavelength solution in each order. Left: 1D ThAr solution, right: 2D ThAr solution. The data from the red detector arm of HARPS at La Silla is showing spectral orders between 89 and 114.
Current usage metrics show cumulative count of Article Views (full-text article views including HTML views, PDF and ePub downloads, according to the available data) and Abstracts Views on Vision4Press platform.
Data correspond to usage on the plateform after 2015. The current usage metrics is available 48-96 hours after online publication and is updated daily on week days.
Initial download of the metrics may take a while.