Fig. 15.
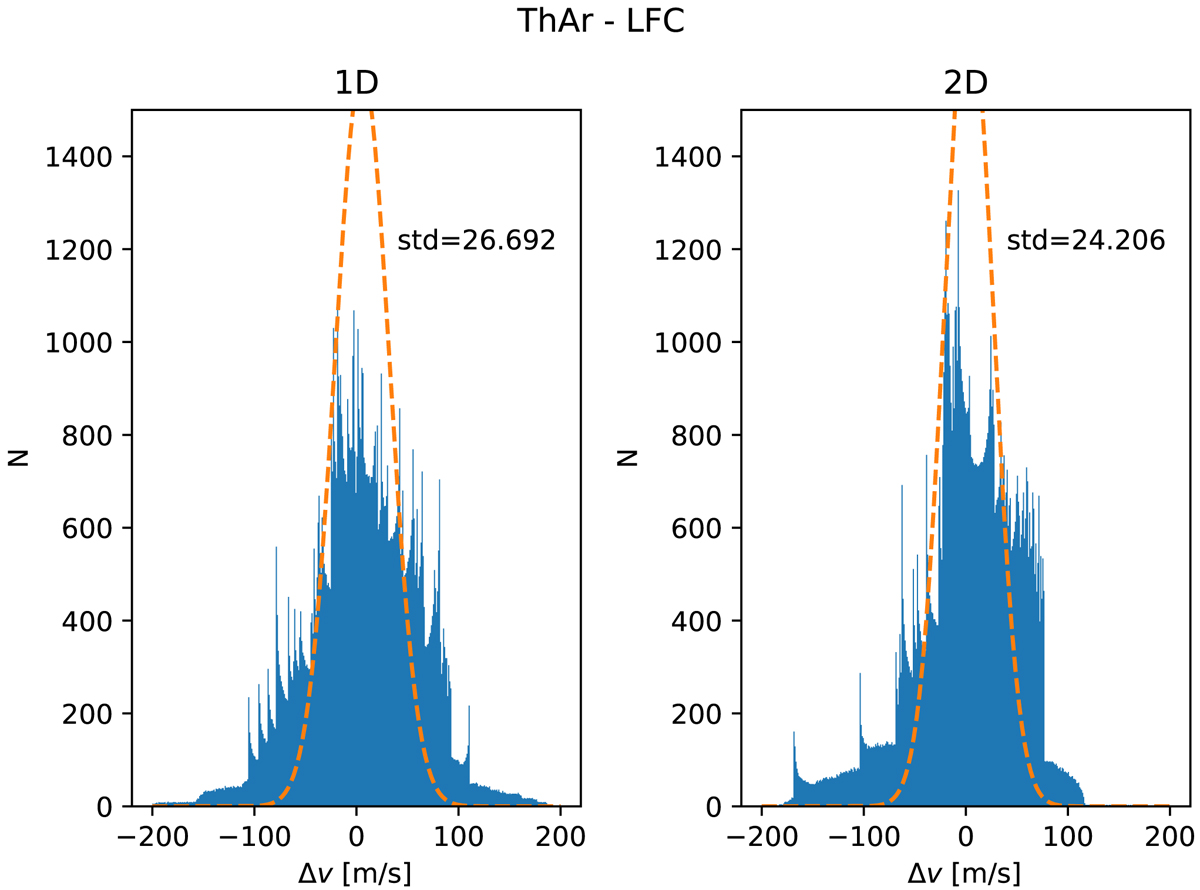
Distribution of the difference between the ThAr wavelength solution and the LFC wavelength solution, evaluated for each point in all orders. The LFC solution is based on a 2D polynomial. There are more outliers beyond the limits of the histogram, which are not shown here. The orange dashed line, shows the Gaussian with the same mean and standard deviation as the whole distribution. Left: 1D ThAr solution, right: 2D ThAr solution.
Current usage metrics show cumulative count of Article Views (full-text article views including HTML views, PDF and ePub downloads, according to the available data) and Abstracts Views on Vision4Press platform.
Data correspond to usage on the plateform after 2015. The current usage metrics is available 48-96 hours after online publication and is updated daily on week days.
Initial download of the metrics may take a while.