Fig. 13.
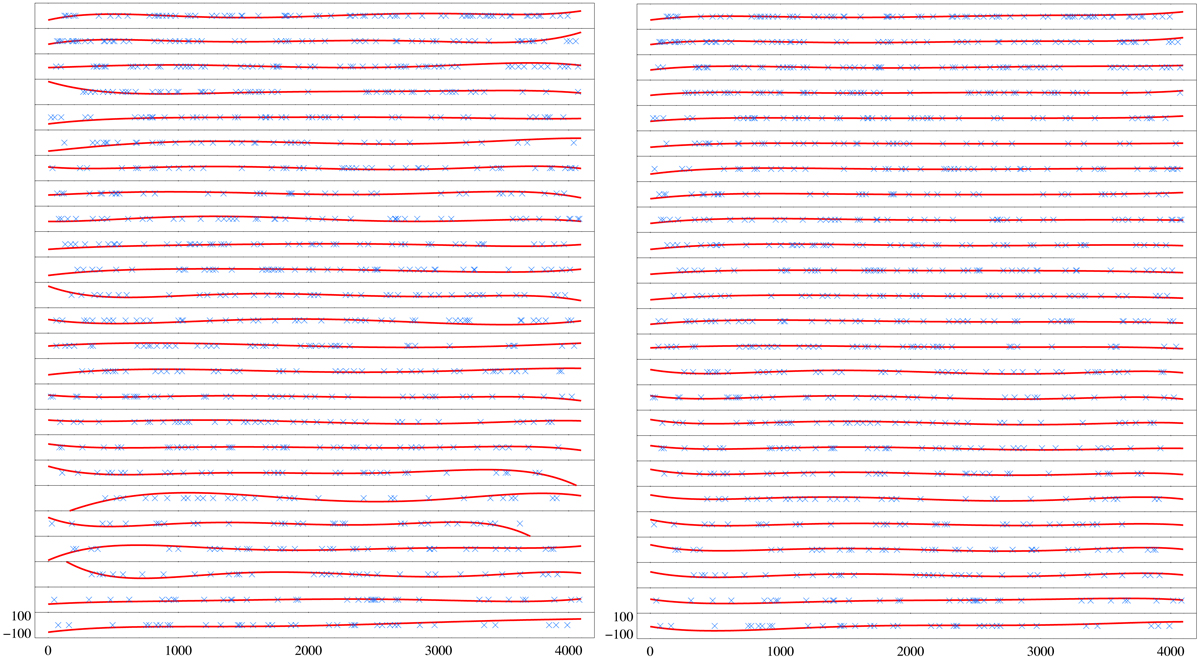
Difference between the LFC wavelength solution and the ThAr-based 1D (left) and 2D (right) solutions for the red detector arm of the La Silla/HARPS spectrometer. Each vertical panel shows one spectral order with the longest wavelength order positioned at the bottom. The differences between ThAr and LFC solutions in m s−1 are plotted as red lines against detector pixels in the X-axis. LFC solutions were constructed separately for each spectral order. Blue crosses indicate the positions of the ThAr lines used for the construction of the wavelength solutions. In all cases, a 5th order polynomial was used for the dispersion direction. The 2D solution included an additional 3rd order cross-dispersion component as well as the corresponding cross-terms.
Current usage metrics show cumulative count of Article Views (full-text article views including HTML views, PDF and ePub downloads, according to the available data) and Abstracts Views on Vision4Press platform.
Data correspond to usage on the plateform after 2015. The current usage metrics is available 48-96 hours after online publication and is updated daily on week days.
Initial download of the metrics may take a while.