Free Access
Fig. 11.
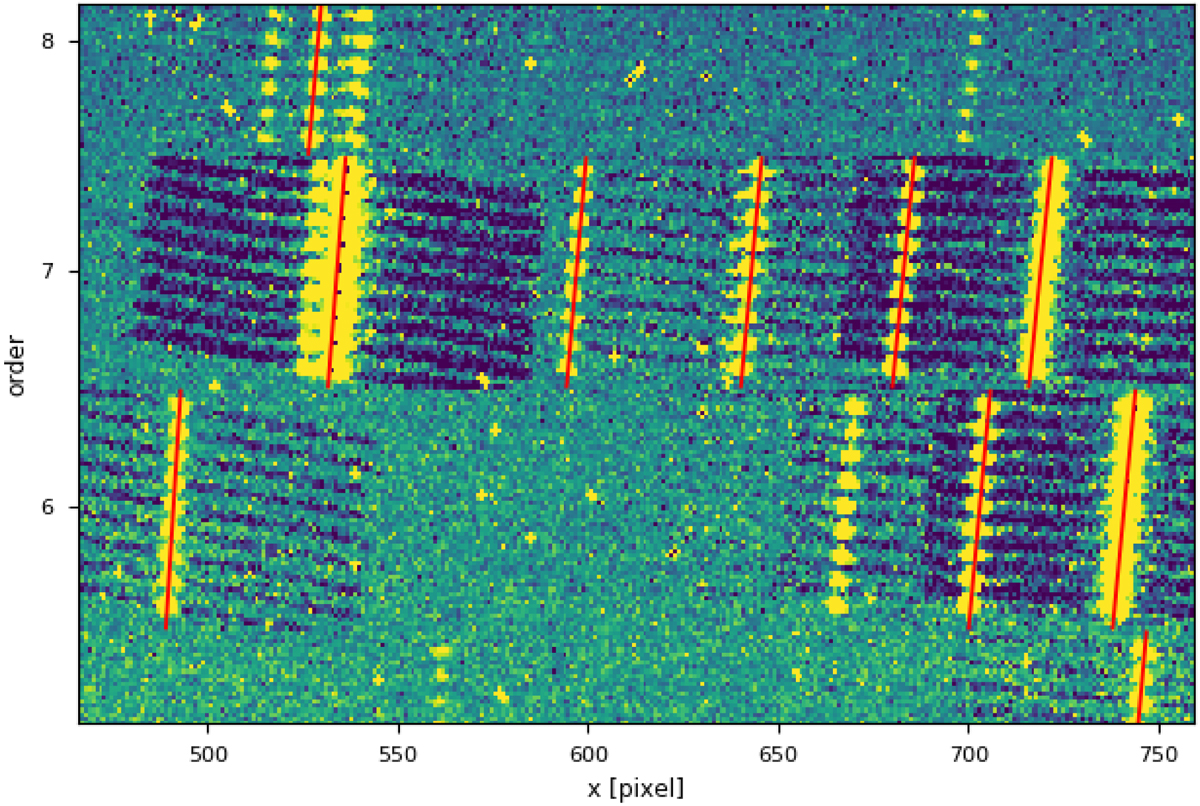
Fragment of the input image used for the slit curvature determination (blue-yellow), with the recovered curvature (red) at line positions plotted on top. The red line is constructed from the final fit of the curvature and tracks the center of each spectral line along the slit. Data from VLT/X-shooter (Vernet et al. 2011).
Current usage metrics show cumulative count of Article Views (full-text article views including HTML views, PDF and ePub downloads, according to the available data) and Abstracts Views on Vision4Press platform.
Data correspond to usage on the plateform after 2015. The current usage metrics is available 48-96 hours after online publication and is updated daily on week days.
Initial download of the metrics may take a while.