Free Access
Fig. 10.
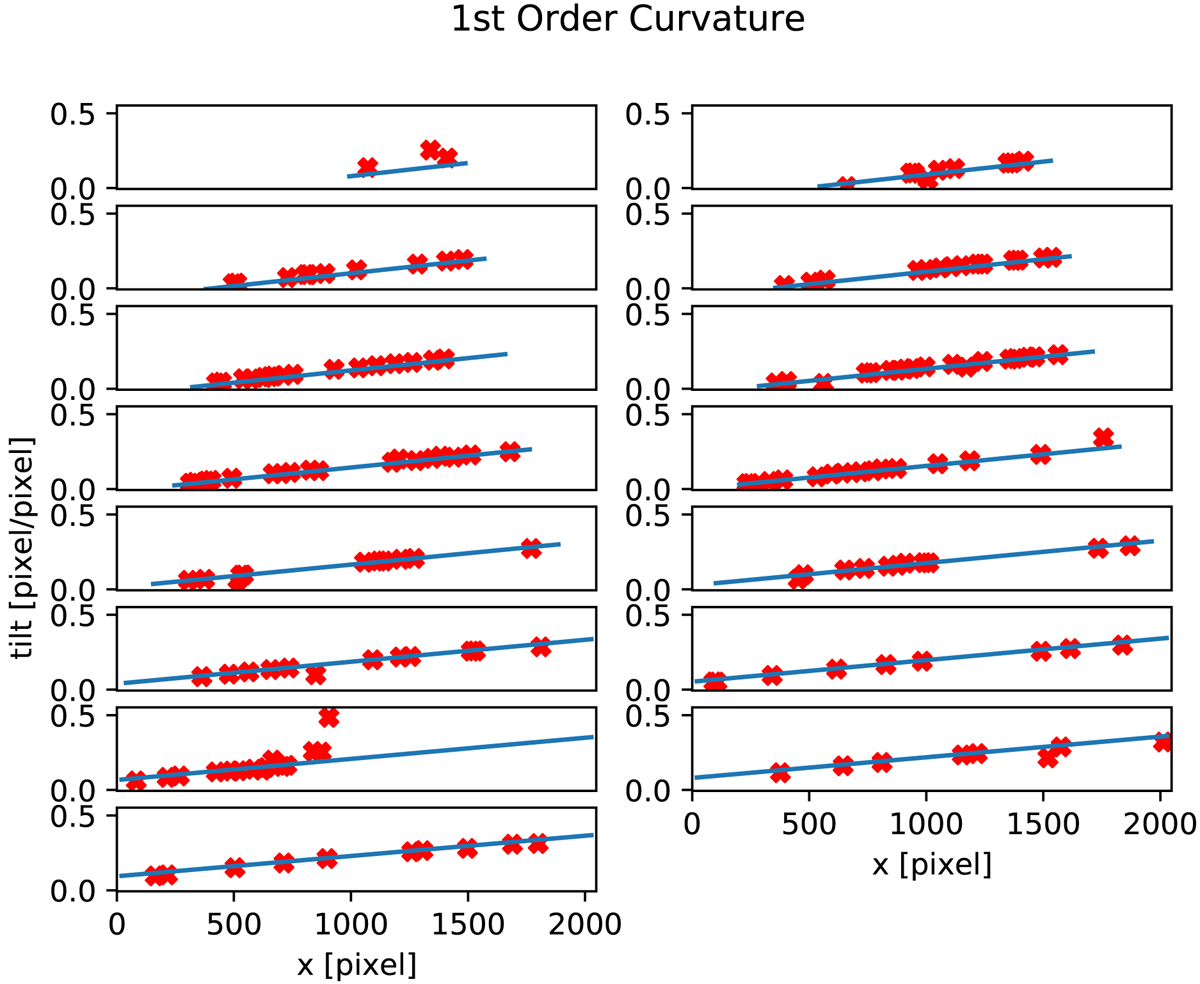
Tilt variations per order (each panel is one order). Red pluses show the tilt determined for each individual emission line. The blue line is the 2D polynomial fit through all lines in all orders. Data from VLT/X-shooter (Vernet et al. 2011).
Current usage metrics show cumulative count of Article Views (full-text article views including HTML views, PDF and ePub downloads, according to the available data) and Abstracts Views on Vision4Press platform.
Data correspond to usage on the plateform after 2015. The current usage metrics is available 48-96 hours after online publication and is updated daily on week days.
Initial download of the metrics may take a while.