Fig. 6.
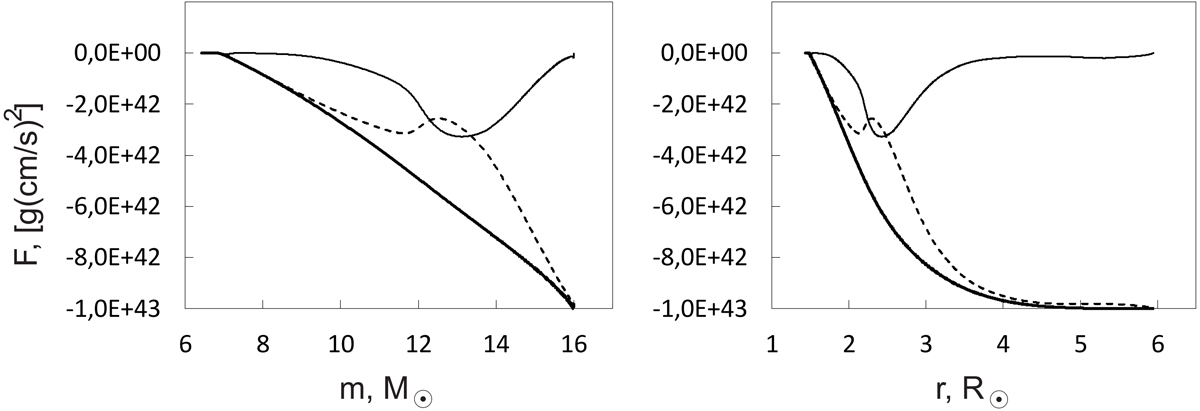
Momentum flux in the star’s interior at the common envelope stage for ζ = 0.8. The turbulent flux Ft (solid line), the advective flux Fad (dashed line), and the total flux F (thick solid line) are shown 30 years after the start of the common envelope stage depending on the mass of the matter inside the isobar (left panel) and the average distance to the isobar (right panel).
Current usage metrics show cumulative count of Article Views (full-text article views including HTML views, PDF and ePub downloads, according to the available data) and Abstracts Views on Vision4Press platform.
Data correspond to usage on the plateform after 2015. The current usage metrics is available 48-96 hours after online publication and is updated daily on week days.
Initial download of the metrics may take a while.