Fig. 6.
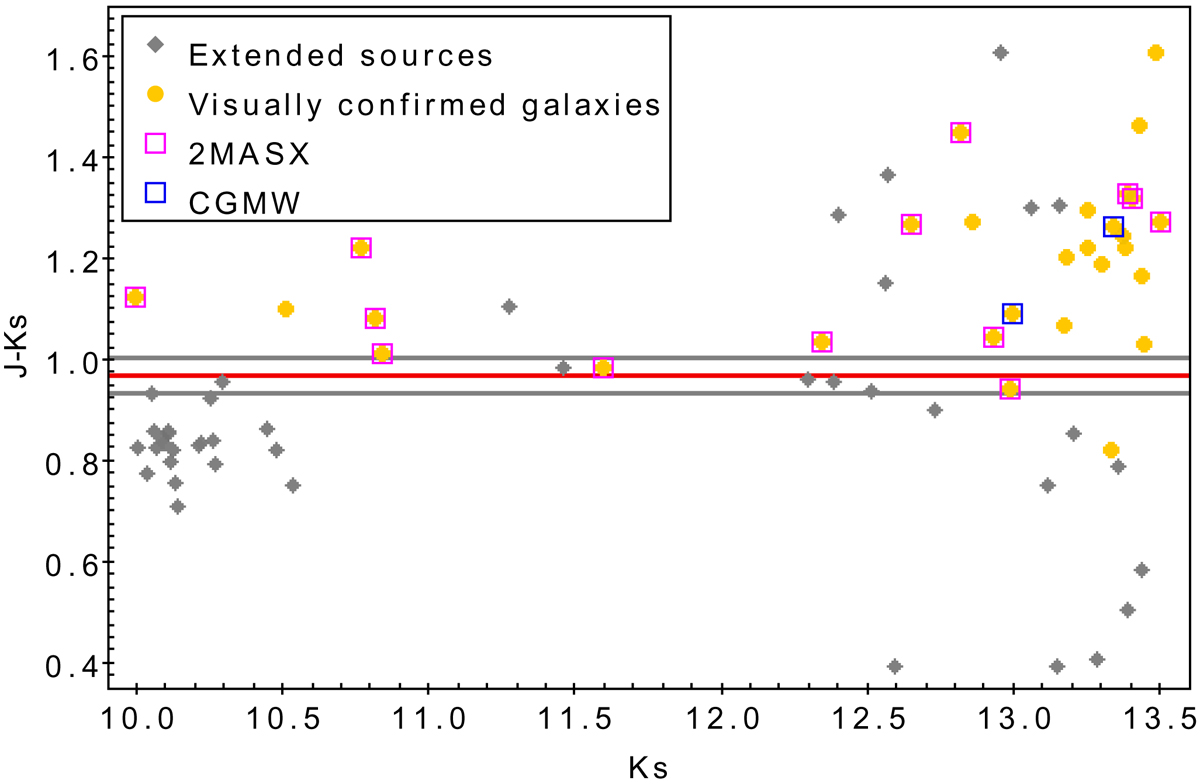
Colour-magnitude diagram (J − Ks vs. Ks) of automatically detected extended sources, visually confirmed galaxy candidates, and catalogued sources in our field. The lines in this figure represent the different colour cuts used in the completeness and contamination analysis. The red line corresponds to the adopted limit J − Ks = 0.97.
Current usage metrics show cumulative count of Article Views (full-text article views including HTML views, PDF and ePub downloads, according to the available data) and Abstracts Views on Vision4Press platform.
Data correspond to usage on the plateform after 2015. The current usage metrics is available 48-96 hours after online publication and is updated daily on week days.
Initial download of the metrics may take a while.