Fig. 12.
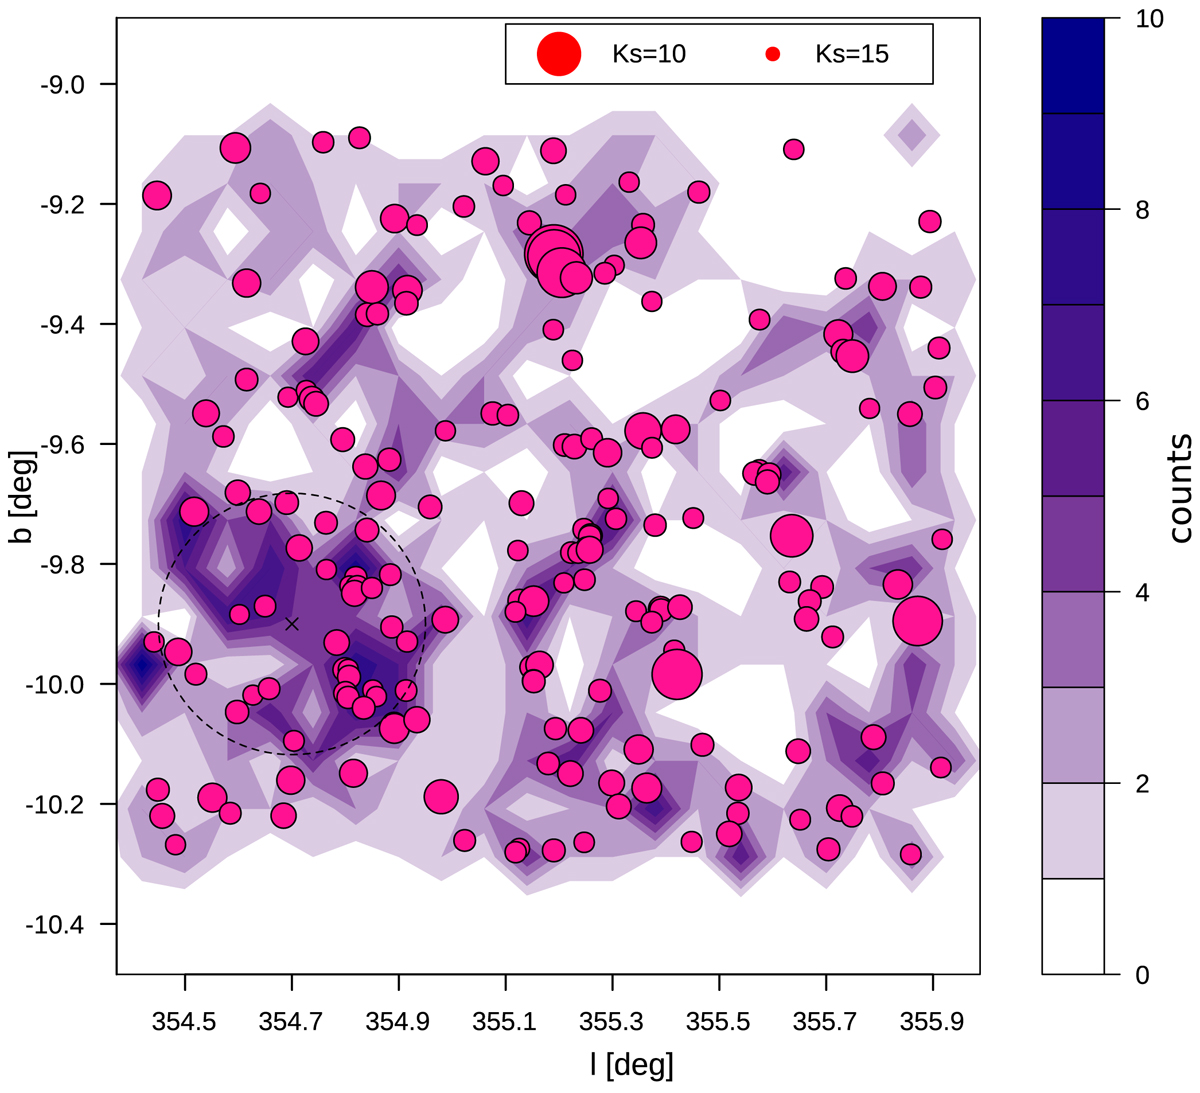
Density map of visually confirmed galaxies. Filled contours are colour−codded according to number counts in pixels of 4 arcmin × 4 arcmin. Dots indicate the positions of the 30% brightest galaxies (dot sizes are weighted according size is proportional to Ks magnitude). The dashed circle, of 15 arcmin radius is centred at the position of the overdense region in the tile.
Current usage metrics show cumulative count of Article Views (full-text article views including HTML views, PDF and ePub downloads, according to the available data) and Abstracts Views on Vision4Press platform.
Data correspond to usage on the plateform after 2015. The current usage metrics is available 48-96 hours after online publication and is updated daily on week days.
Initial download of the metrics may take a while.