Free Access
Fig. 11.
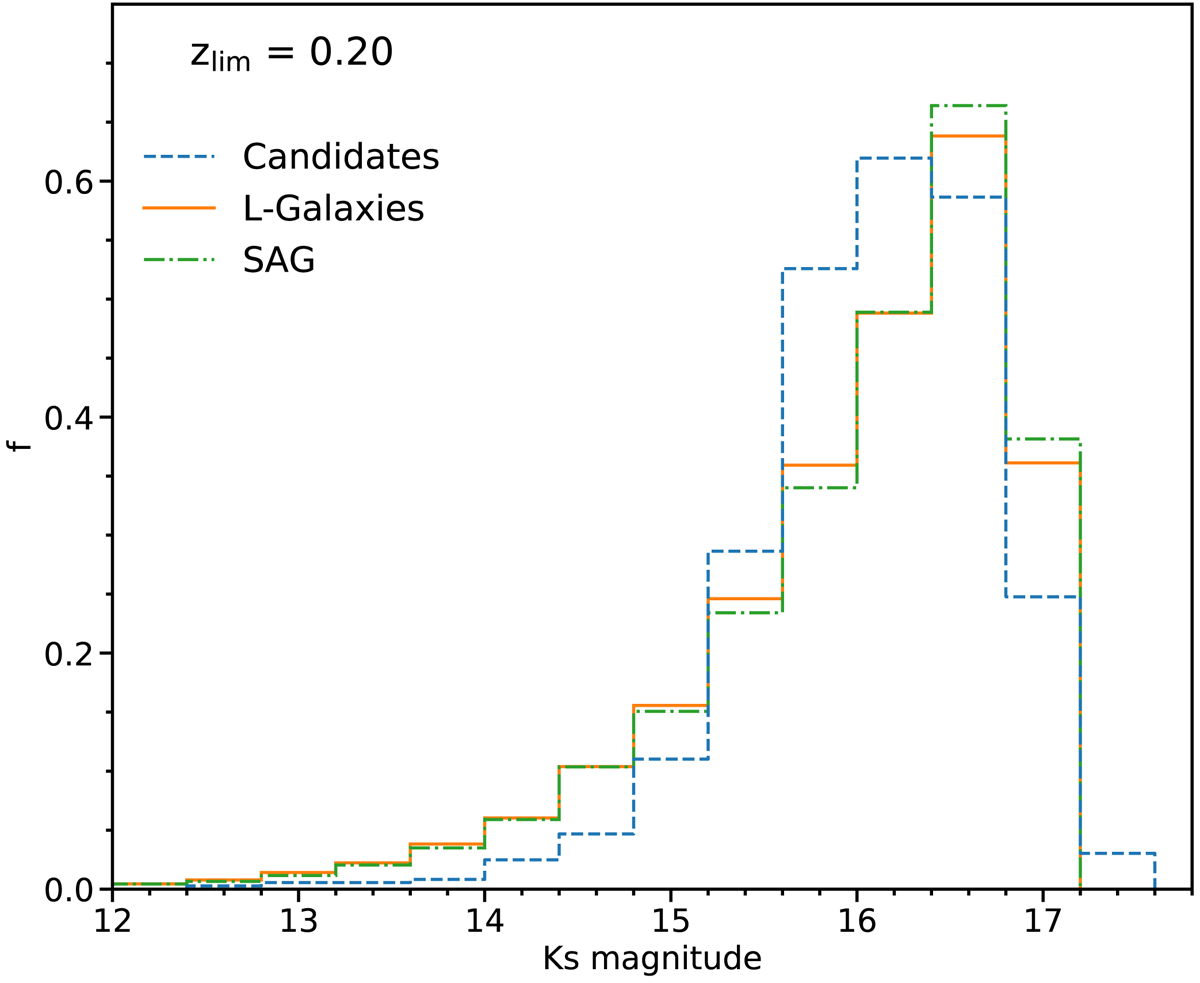
Normalised distributions of Ks magnitude of galaxy candidates in tile b204 (blue dashed line), compared with those from L-Galaxies and SAG with the Gonzalez et al. (2012) extinction model (continuous lines of orange and green colours, respectively).
Current usage metrics show cumulative count of Article Views (full-text article views including HTML views, PDF and ePub downloads, according to the available data) and Abstracts Views on Vision4Press platform.
Data correspond to usage on the plateform after 2015. The current usage metrics is available 48-96 hours after online publication and is updated daily on week days.
Initial download of the metrics may take a while.