Fig. 10.
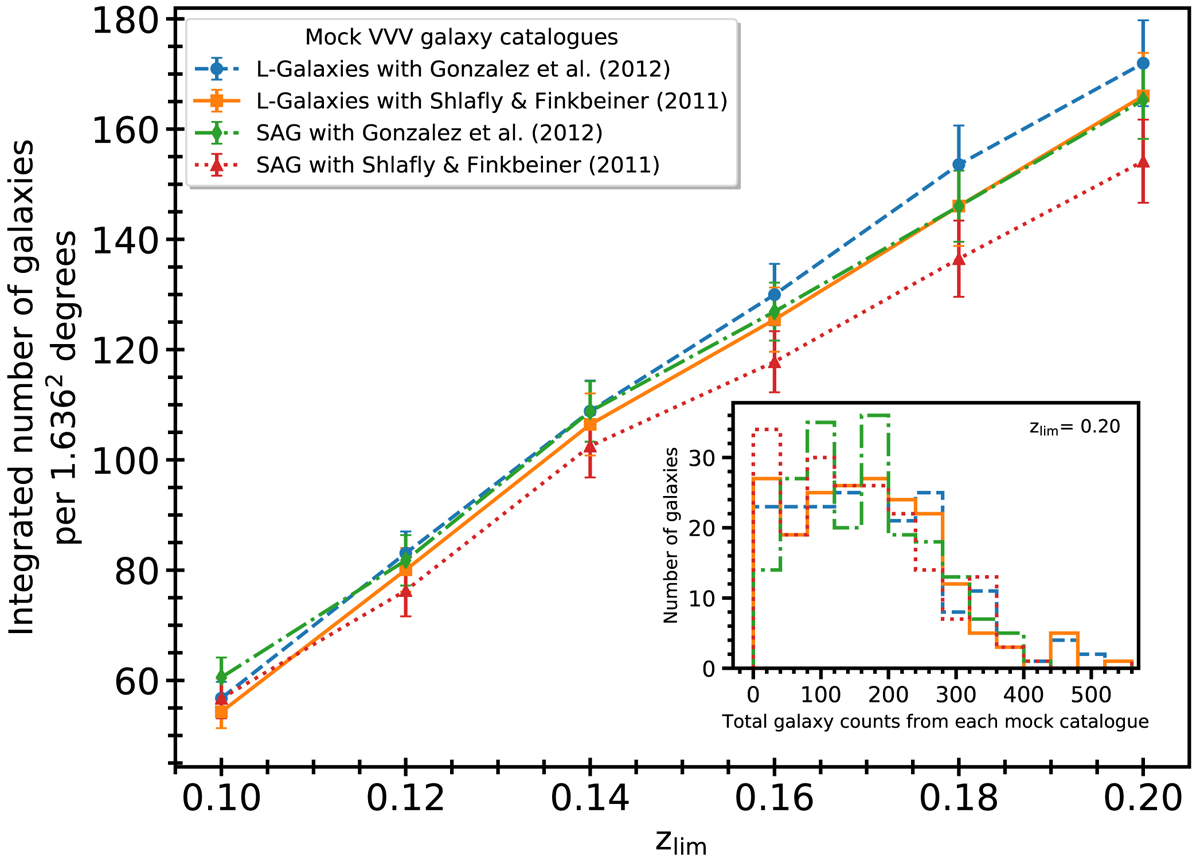
Integrated number of galaxies per 1.636 deg2 as a function of the redshift limits used to construct the light cones. The results for both SAG and L-Galaxies are shown, using the extinction maps of Gonzalez et al. (2012) and Schlafly & Finkbeiner (2011), as indicated in the key. The inset shows the total galaxy number counts from each mock catalogue by changing the line-of-sight direction of the light cone with a redshift limit of 0.20.
Current usage metrics show cumulative count of Article Views (full-text article views including HTML views, PDF and ePub downloads, according to the available data) and Abstracts Views on Vision4Press platform.
Data correspond to usage on the plateform after 2015. The current usage metrics is available 48-96 hours after online publication and is updated daily on week days.
Initial download of the metrics may take a while.