Fig. 7.
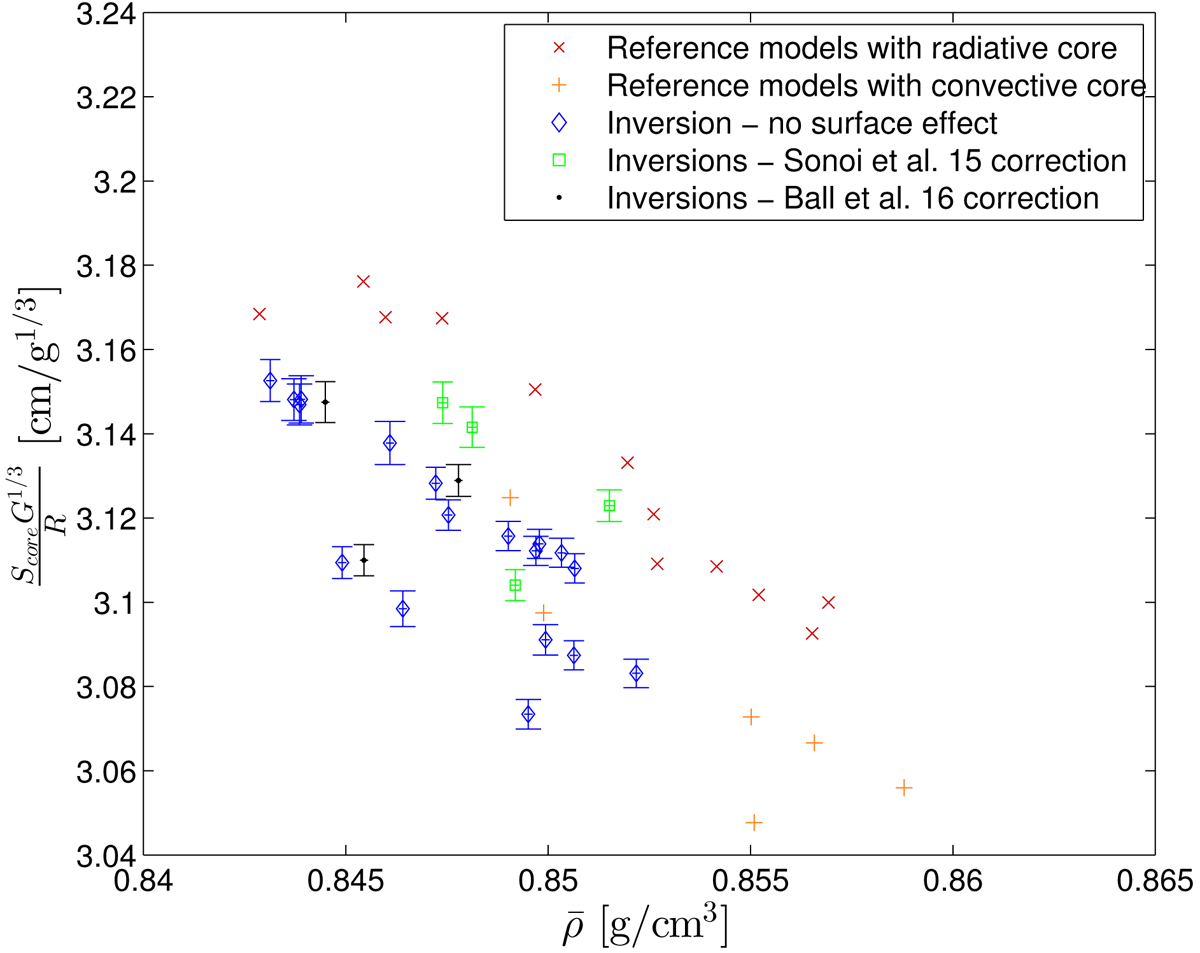
Inversion results for α Cen A for both the mean density and the SCore indicator. Reference values from forward seismic modelling are given in red and orange, corresponding respectively to models without or with a convective core. Blue, green and black symbols represent the inversion results obtained with different treatments of surface effects (see legend).
Current usage metrics show cumulative count of Article Views (full-text article views including HTML views, PDF and ePub downloads, according to the available data) and Abstracts Views on Vision4Press platform.
Data correspond to usage on the plateform after 2015. The current usage metrics is available 48-96 hours after online publication and is updated daily on week days.
Initial download of the metrics may take a while.