Fig. 2.
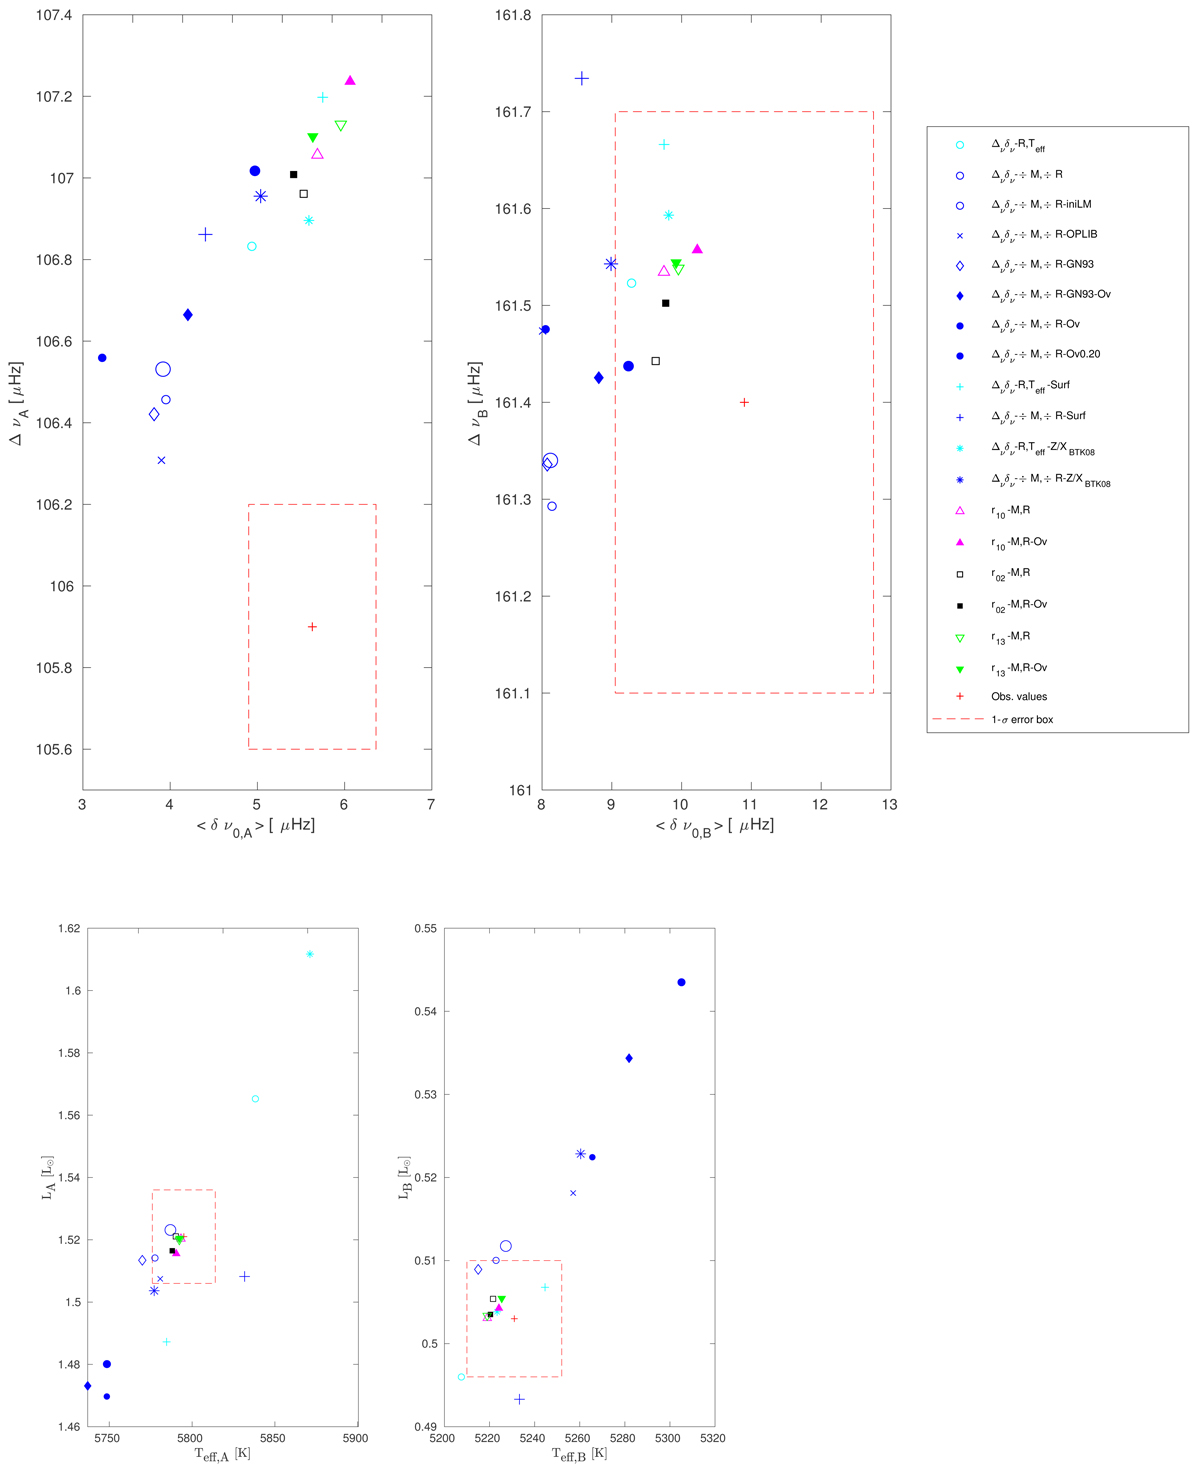
Top left and right panels: large and small frequency separations of the final inferred models of α Cen A and B, for the various asteroseismic calibrations. Symbols are the same as those used in Fig. 1, except for the red cross and dashed line, which represent respectively the observed values and their 1σ error box, that we derived from the pulsation frequency analysis made by de Meulenaer et al. (2010). Bottom panels: Hertzsprung-Russell diagram for the results of the different calibrations compared to the observational values of K17. The A and B components are depicted respectively in the left and right panels. The legend details are the same as in the top panels.
Current usage metrics show cumulative count of Article Views (full-text article views including HTML views, PDF and ePub downloads, according to the available data) and Abstracts Views on Vision4Press platform.
Data correspond to usage on the plateform after 2015. The current usage metrics is available 48-96 hours after online publication and is updated daily on week days.
Initial download of the metrics may take a while.