Fig. 1.
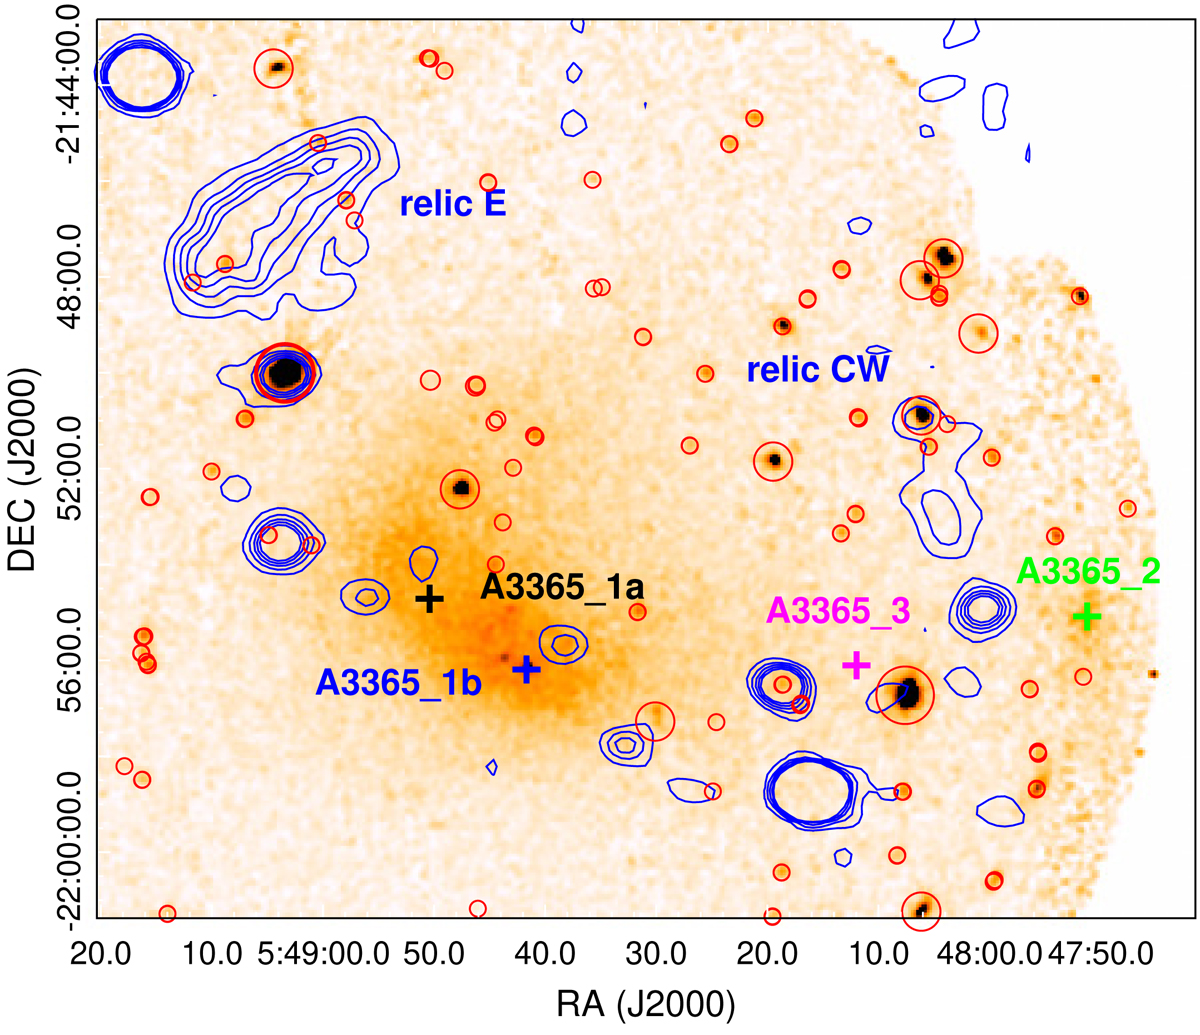
XMM-Newton smoothed image of A3365 in the 0.5–2 keV band. Red circles are the point sources that have been removed. VLA 1.4 GHz radio contours are shown in blue. The center of the three subclusters: A3365_1a, A3365_2 and A3365_3, identified by Golovich et al. (2019) are marked with black, magenta and green crosses, respectively. The X-ray emission peak is shown with a blue cross, A3365_1b.
Current usage metrics show cumulative count of Article Views (full-text article views including HTML views, PDF and ePub downloads, according to the available data) and Abstracts Views on Vision4Press platform.
Data correspond to usage on the plateform after 2015. The current usage metrics is available 48-96 hours after online publication and is updated daily on week days.
Initial download of the metrics may take a while.