Fig. 9.
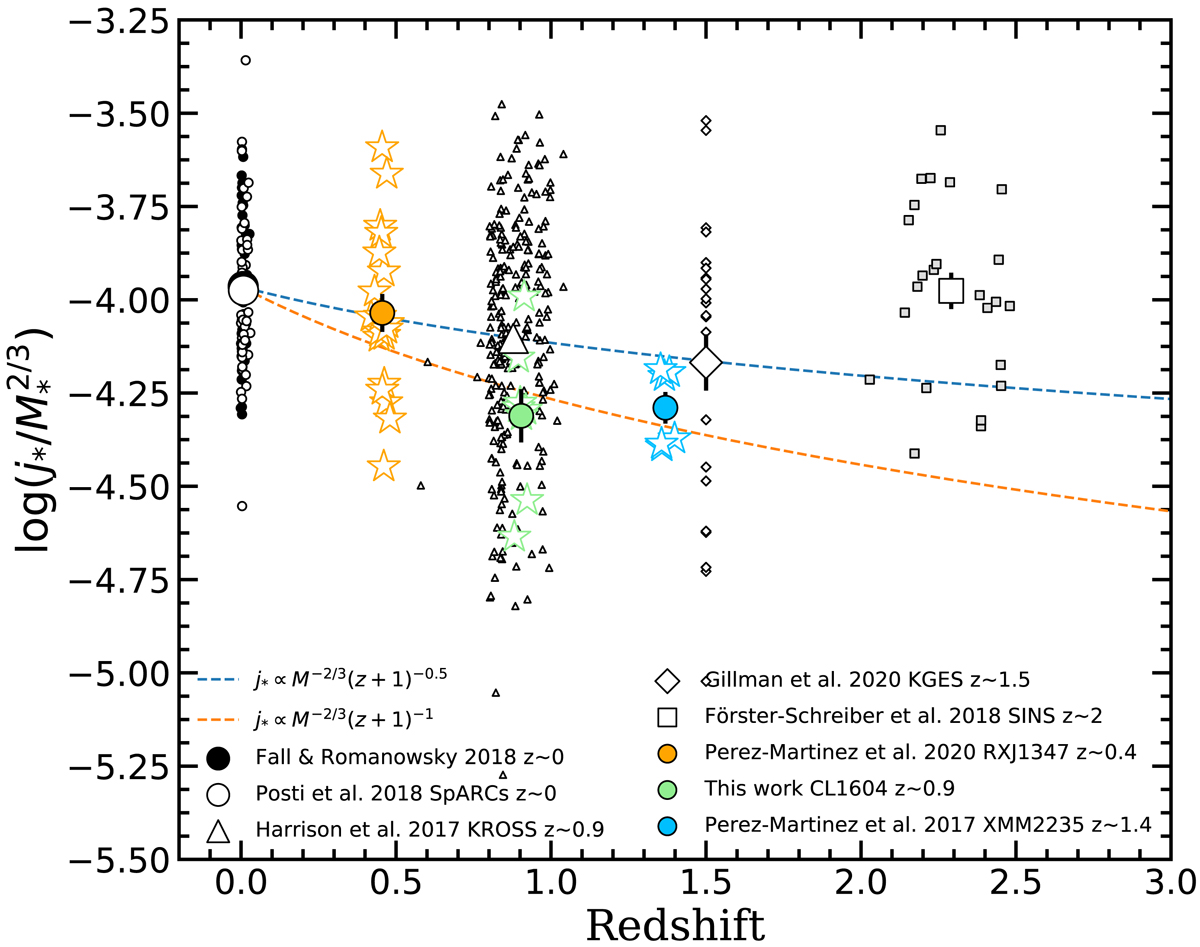
Redshift evolution of j*/M2/3 from z = 0 to z ∼ 2.5. The large black and empty circles show the mean value for the local field galaxies from Fall & Romanowsky (2018) (small black cirles) and Posti et al. (2018) (small empty cirles), respectively. The large empty triangle depicts the average value for the KROSS sample at z ∼ 0.9 (small triangles, Harrison et al. 2017). The empty diamond displays the KGES sample at z ∼ 1.5 (small empty diamonds), and the empty square represents the field galaxies at 2 < z < 2.5 from Förster Schreiber et al. (2018) (small gray squares). The average j*/M2/3 values for the RXJ1347, CL1604, and XMM2235 cluster samples are shown by the orange, green, and blue circles, respectively. The errors of the mean are plotted as error bars for each symbol. The dashed lines represent the expected evolution of the angular momentum with redshift according to the ΛCDM cosmology: j* = M−2/3(z + 1)−n with n = 0.5 (blue) and n = 1 (orange).
Current usage metrics show cumulative count of Article Views (full-text article views including HTML views, PDF and ePub downloads, according to the available data) and Abstracts Views on Vision4Press platform.
Data correspond to usage on the plateform after 2015. The current usage metrics is available 48-96 hours after online publication and is updated daily on week days.
Initial download of the metrics may take a while.