Fig. 8.
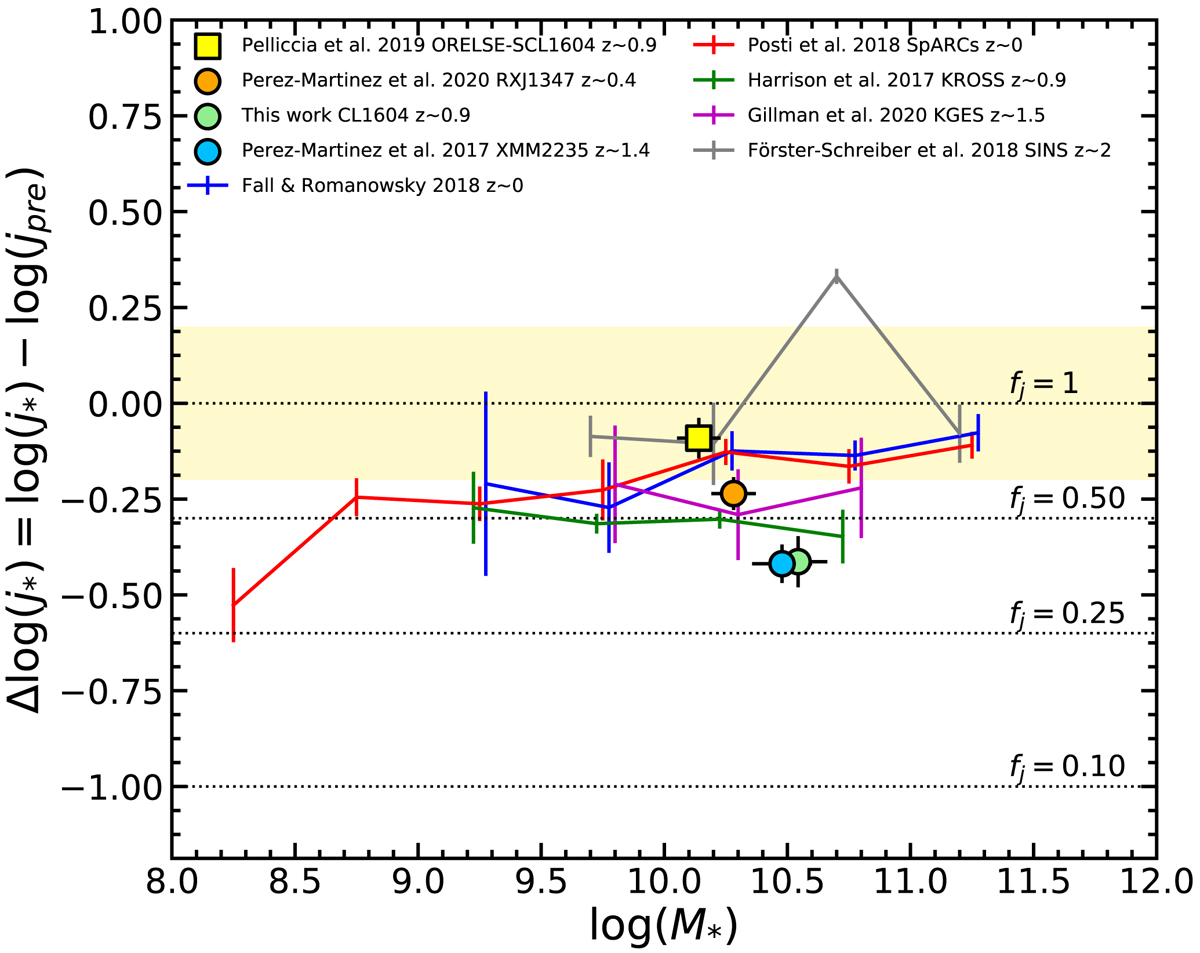
Specific angular momentum offsets (Δlog(j*)) as a function of stellar mass. The solid colored lines depict the mean values and the error of the mean of the mass-binned field samples using bin widths of 0.5 dex. Blue and red lines depict the local universe disk samples from Fall & Romanowsky (2018) and Posti et al. (2018), respectively. The green line shows the distribution of objects from the KROSS sample at z ∼ 0.9 (Harrison et al. 2017). The purple line shows the z ∼ 1.5 KGES sample of galaxies (Gillman et al. 2020), while SINS/zC-SINF galaxies at z ∼ 2 are displayed by the gray line (Förster Schreiber et al. 2018). The dotted lines mark different predicted values of fj as a function of Δlog(j). The light yellow band depicts the predicted scatter in the spin parameter λ assuming fj = 1. The orange, green, and blue circles show the mean Δlog(j)−log(M*) values and their errors for the RXJ1347, CL1604, and XMM2235 cluster galaxies, respectively. Finally, the yellow square displays the average value for Pelliccia et al. (2019) cluster sample.
Current usage metrics show cumulative count of Article Views (full-text article views including HTML views, PDF and ePub downloads, according to the available data) and Abstracts Views on Vision4Press platform.
Data correspond to usage on the plateform after 2015. The current usage metrics is available 48-96 hours after online publication and is updated daily on week days.
Initial download of the metrics may take a while.