Free Access
Fig. 6.
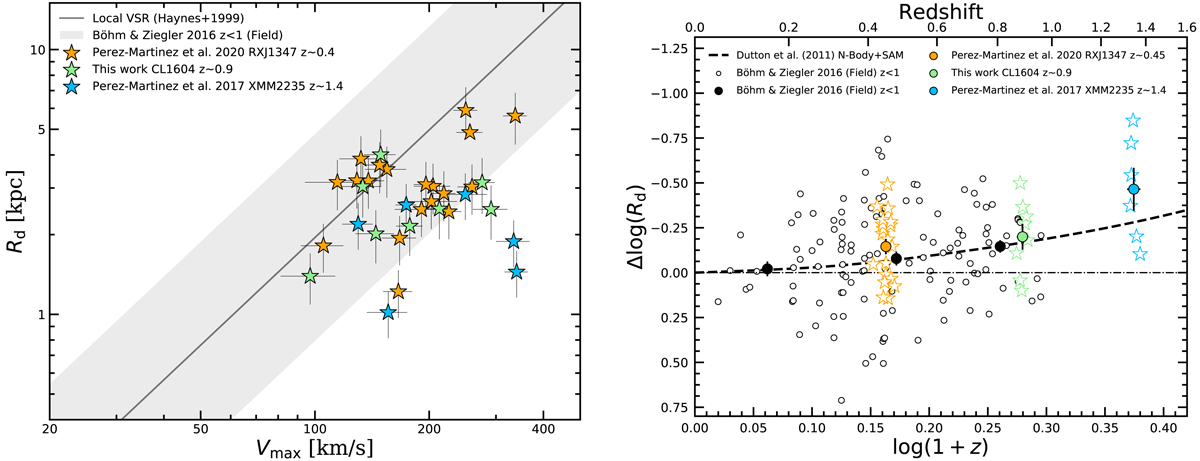
Symbols and color schemes are the same as in Fig. 5. Left: velocity-size diagram. The solid black line shows the local VSR from Haynes et al. (1999a), with a 3σ scatter gray area around it. Right: velocity-size offset evolution.
Current usage metrics show cumulative count of Article Views (full-text article views including HTML views, PDF and ePub downloads, according to the available data) and Abstracts Views on Vision4Press platform.
Data correspond to usage on the plateform after 2015. The current usage metrics is available 48-96 hours after online publication and is updated daily on week days.
Initial download of the metrics may take a while.