Fig. 5.
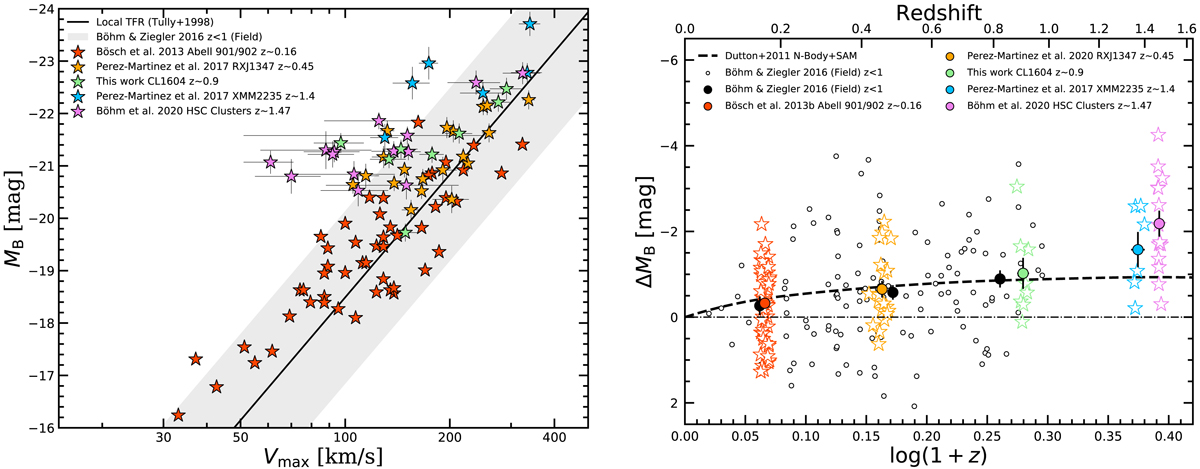
Left: B-band TFR. Colored stars represent the different cluster samples that compose our study. The solid black line shows the local B-band TFR (Tully et al. 1998) with a 3σ scatter area reported by Böhm & Ziegler (2016) for galaxies at 0 < z < 1 (gray area). Right: B-band TFR offset evolution. Stars with colored edges represent the distribution of our cluster samples, and their respective mean values are shown as larger circles of the same color. Error bars represent the error of the mean for every sample. Open circles display the Böhm & Ziegler (2016) field sample at 0.1 < z < 1. We binned the field sample into three redshift intervals (0 < z < 0.33, 0.33 < z < 0.66, and 0.66 < z < 1). Black circles depict the mean value and its error for the field sample in every redshift window. The dashed line represents the predicted B-band luminosity evolution by Dutton et al. (2011) in the TFR, and the dash-dotted line at ΔMB = 0 means no size evolution.
Current usage metrics show cumulative count of Article Views (full-text article views including HTML views, PDF and ePub downloads, according to the available data) and Abstracts Views on Vision4Press platform.
Data correspond to usage on the plateform after 2015. The current usage metrics is available 48-96 hours after online publication and is updated daily on week days.
Initial download of the metrics may take a while.