Free Access
Fig. 4.
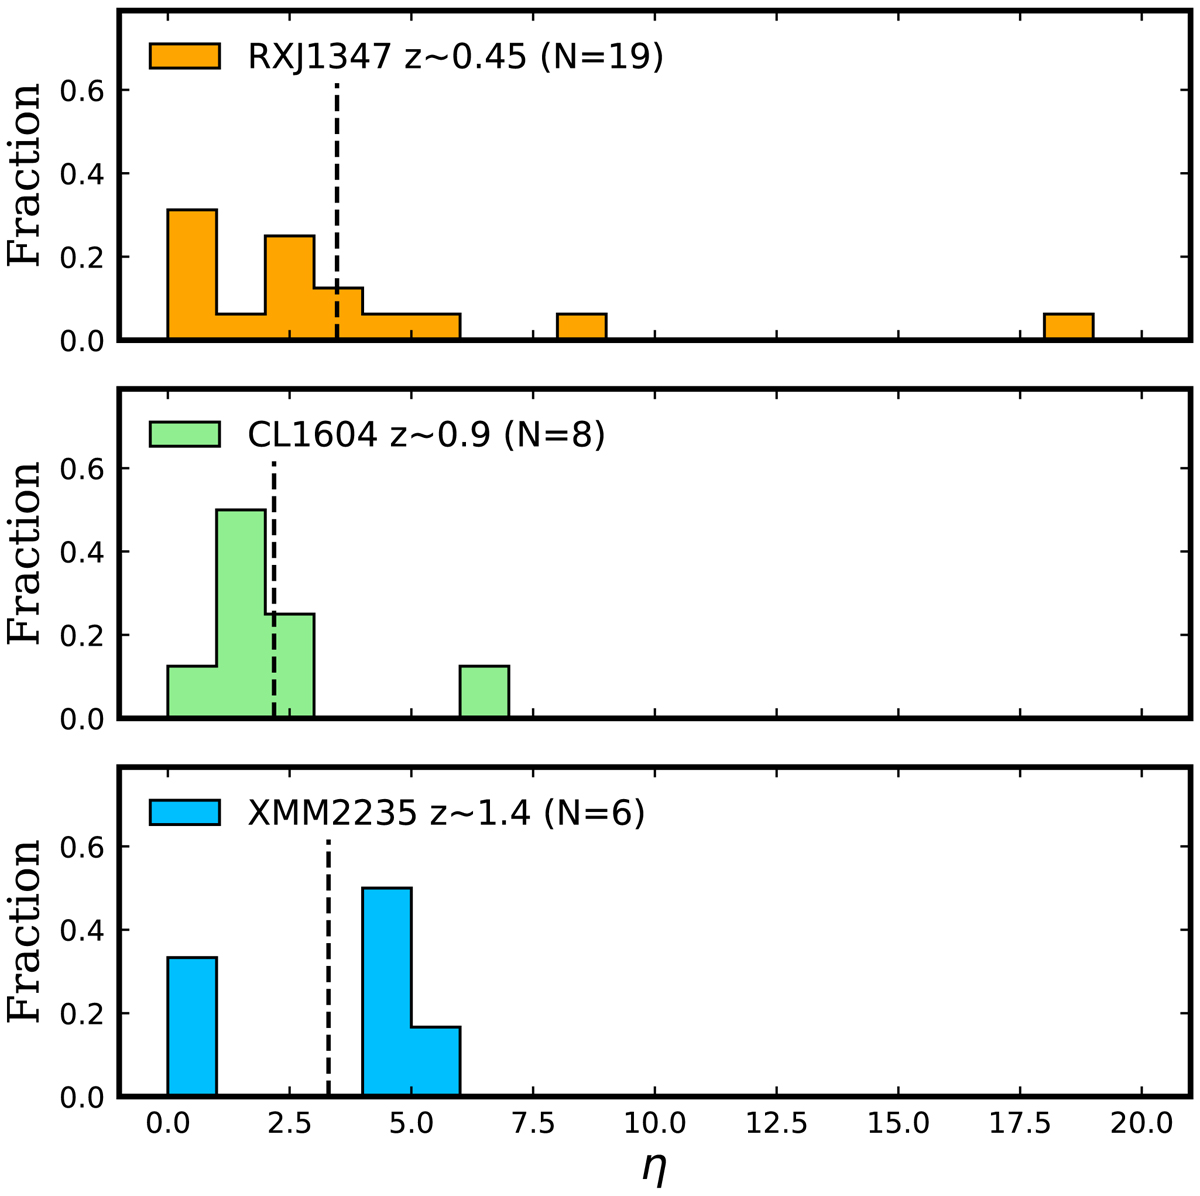
Global environment distribution of galaxies for RXJ1347, CL1604, and XMM2235 clusters. The η value of each object has been computed according to its nearest cluster in Table 1. The dashed line displays the mean value of each sample.
Current usage metrics show cumulative count of Article Views (full-text article views including HTML views, PDF and ePub downloads, according to the available data) and Abstracts Views on Vision4Press platform.
Data correspond to usage on the plateform after 2015. The current usage metrics is available 48-96 hours after online publication and is updated daily on week days.
Initial download of the metrics may take a while.