Fig. 3.
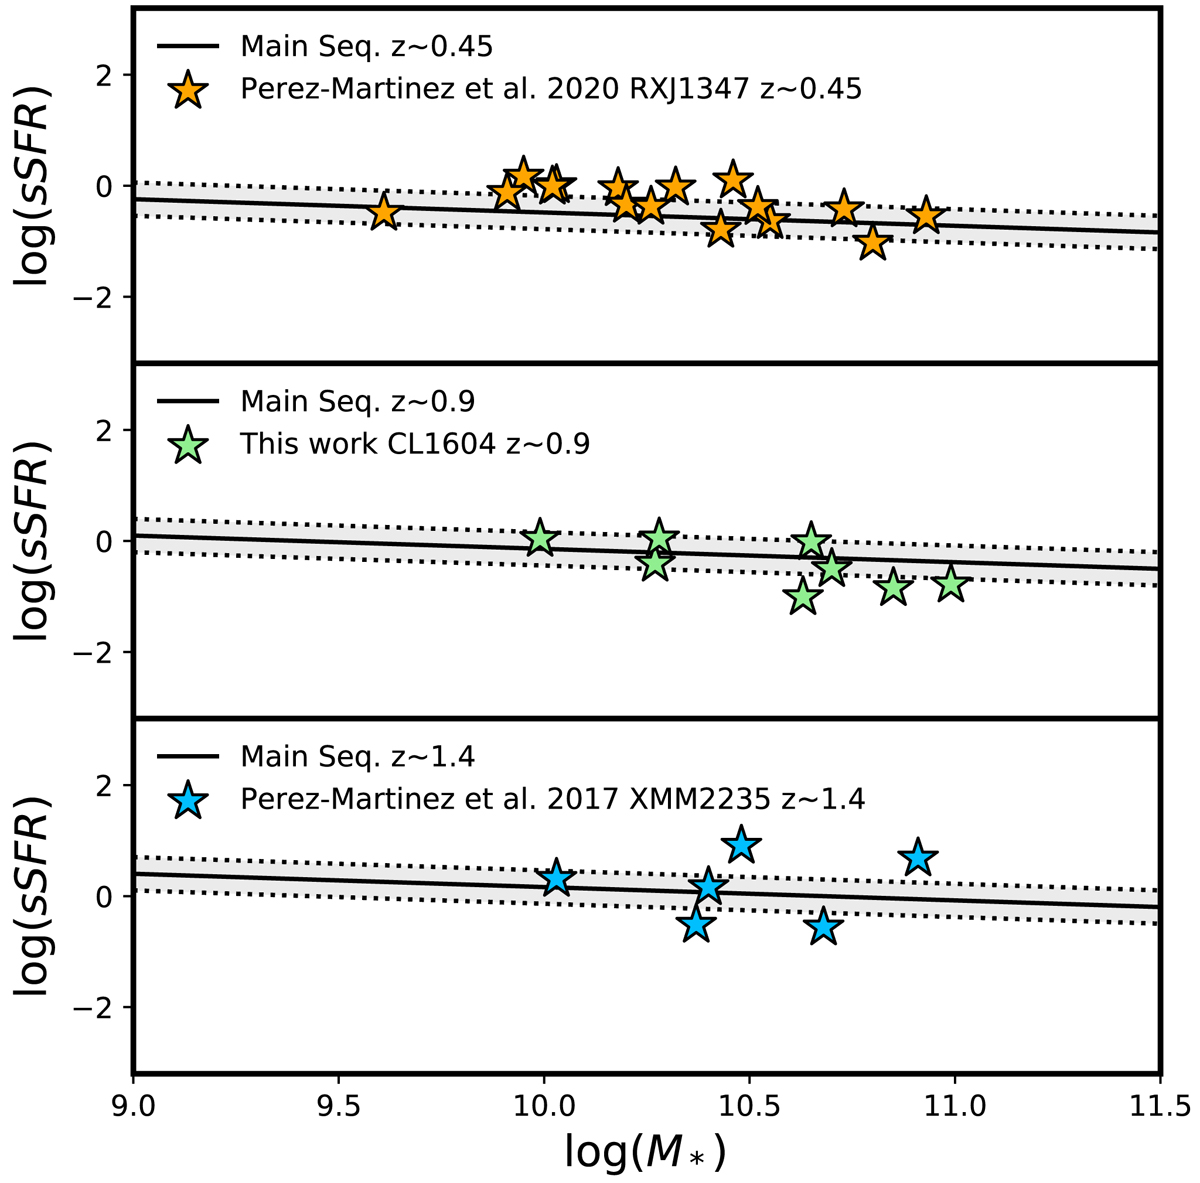
Star formation activity as a function of stellar mass. Orange, green, and blue stars display cluster galaxies within RXJ1347, CL1604, and XMM2235, respectively. The solid line shows the main sequence of star-forming galaxies at z ∼ 0.45, z ∼ 0.90, z ∼ 1.4 extrapolated by Peng et al. (2010), and the gray area indicates the 3σ scatter.
Current usage metrics show cumulative count of Article Views (full-text article views including HTML views, PDF and ePub downloads, according to the available data) and Abstracts Views on Vision4Press platform.
Data correspond to usage on the plateform after 2015. The current usage metrics is available 48-96 hours after online publication and is updated daily on week days.
Initial download of the metrics may take a while.